- Person who wants to write program of nonlinear support vector machine
- A person studying machine learning to solve a classification problem
- A person performing model parameter identification for research
Hi, This is a research archive article, but please see if you want to see this.
So, what am I doing ?
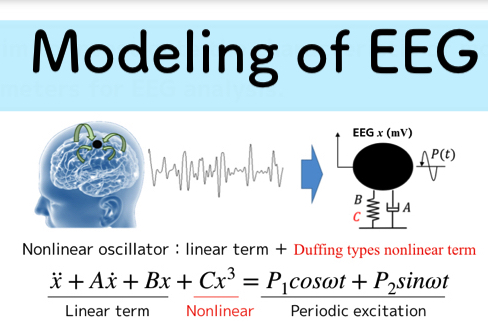
- Modeling the EEG signal
- Identify model parameters by solving the inverse problem
- Classification by SVM to determine concentration or relax state
I’m doing something like this.
If you want to know more detail, please go to this page.
This is my first time to write blog in English. Today, …
Actually, I am writing a dissertation, so I can not write specific data on my blog.
But, python program code is managed in my blog.
So, you can use it for free.
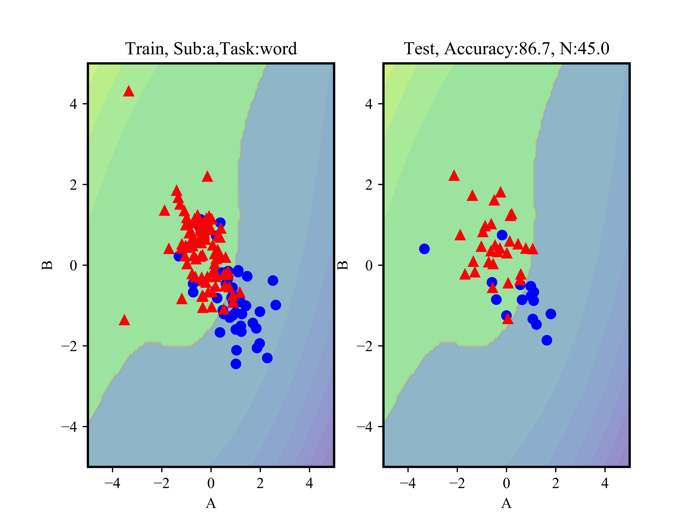
I’m showing some unused data.
Red marks are concentrated state and blue marks are relax state.

Classification is possible for data that can be linearly separated.
The left side shows the data used to draw classification lines while the right side shows the data to test weather the line works well.
The accuracy rate is about 87 % (It is given above).
I think that experimental data itself is not very good, so it is necessary to recover experimental data again.
Programming of nonlinear support vector machine
I will write a program for nonlinear support vector machine!
1 2 3 4 5 6 7 8 9 10 11 12 13 14 15 16 17 18 19 20 21 22 23 24 25 26 27 28 29 30 31 32 33 34 35 36 37 38 39 40 41 42 43 44 45 46 47 48 49 50 51 52 53 54 55 56 57 58 59 60 61 62 63 64 65 66 67 68 69 70 71 72 73 74 75 76 77 78 79 80 81 82 83 84 85 86 87 88 89 90 91 92 | # -*- coding: utf-8 -*- import numpy as np import matplotlib.pyplot as plt from sklearn.model_selection import train_test_split from sklearn.preprocessing import StandardScaler from sklearn.pipeline import Pipeline from sklearn.preprocessing import PolynomialFeatures from sklearn.svm import SVC #--plt., Collective setting-----------# plt.rcParams['font.family'] = 'Times New Roman' #全体のフォントを設定 plt.rcParams['font.size'] = 10 #フォントサイズを設定 plt.rcParams['axes.linewidth'] = 1.5 #軸の太さを設定。目盛りは変わらない #------------------------------------------# #----Name for analysis data------# subject = "b" task = "100" #100,game,word #-----------------------------------------# #----------Analysis data reading---------------# inputTarget = 'rectan_3s/target.txt' inputData_a = 'rectan_3s/para4Freq3_%s_%s_3s.txt' %(subject,task) target = np.loadtxt(inputTarget, dtype='float') dataA = np.loadtxt(inputData_a, delimiter='\t', dtype='float') #-----------------------------------------------------# X = np.vstack((dataA[:180, 1:3])) #rabelを追加 0=relax,1=stress y = np.hstack((target[:180])) y = y.astype(np.int64) #解析データの分布を標準化しておく scaler = StandardScaler() X = scaler.fit_transform(X) X_train, X_test, y_train, y_test = train_test_split(X, y, stratify=y, random_state=0) print(X_test.shape[0]) X_train_number = X_test.shape[0] #----------Function for graph drawing---------------# def plot_decision_function(model): _x0 = np.linspace(-5.0, 5.0, 100) _x1 = np.linspace(-5.0, 5.0, 100) x0, x1 = np.meshgrid(_x0, _x1) X = np.c_[x0.ravel(), x1.ravel()] y_pred = model.predict(X).reshape(x0.shape) y_decision = model.decision_function(X).reshape(x0.shape) plt.contourf(x0, x1, y_pred, cmap=plt.cm.brg, alpha=0.2) plt.contourf(x0, x1, y_decision,levels=10,alpha=0.3) def plot_dataset(X,y): plt.plot(X[:, 0][y==0], X[:, 1][y==0], "bo", ms=10) plt.plot(X[:, 0][y==1], X[:, 1][y==1], "r^", ms=10) plt.xlabel("A") plt.ylabel("B") #-----------------------------------------------------------# #--SVM-Kernel method (using pipeline) ---------# kernel_svm = Pipeline([ ('scaler',StandardScaler()), ('svm', SVC(kernel='poly', degree=3, coef0=1)) ]) print(kernel_svm.fit(X_train,y_train)) print(X.shape) kernel_svm.fit(X_train,y_train) #テストデータを使って,予測した分類がそれぞれ正しいのかを見る print(kernel_svm.predict(X_test) == y_test) R = kernel_svm.predict(X_test) total = len(X_test) success = sum(R == y_test) print('被験者%sのタスク%sの正解率=' %(subject,task)) print(100.0*success/total) #----------------------------------------------------------# #--Draw or save a graph (1 by 2)------# plt.subplot(121) plot_decision_function(kernel_svm) plot_dataset(X_train,y_train) plt.title('Train, Sub:%s,Task:%s'%(subject,task)) plt.subplot(122) #plt.figure(figsize=(12,8)) plot_decision_function(kernel_svm) plot_dataset(X_test,y_test) #plt.show() plt.title('Test, Accuracy:{:.1f}, N:{:.1f}'.format(100.0*success/total, X_train_number) ) plt.savefig('para4Freq3_%s_%s_3s.png' %(subject, task), dpi=1200) #plt.show() #------------------------------------------------# |
I commended the code, so it might be understandable
SVM parameters
In this code, the kernel method is described by pipeline.
The data of X_train and y_train are used by the following SVM parameters..
1 2 3 4 5 | Pipeline(memory=None, steps=[('scaler', StandardScaler(copy=True, with_mean=True, with_std=True)), ('svm', SVC(C=1.0, cache_size=200, class_weight=None, coef0=1, decision_function_shape='ovr', degree=3, gamma='auto_deprecated', kernel='poly', max_iter=-1, probability=False, random_state=None, shrinking=True, tol=0.001, verbose=False))]) |

Polynominal kernel
For high-dimensional mapping of feature quantities, we use 3-dimensional mapping using a polynomial kernel.

Standard Scalar
We are standardizing pre-processing of data

Standardize to compare other condition data.
That’s all the important.


