This is my first time to write blog in English.
Today, I want to share my research through this blog to all over the world, to researchers who interest to EEG study.
I always try to make a model of Electroencephalogram (EEG for short) to analyze your stress condition.
In this blog, I just want to introduce how we model EEG?
how we use a EEG dataset? How we analyze our condition by eeg? something like that.
I’m going to use a presentation document which I suppose to use in the International conference in Pittsburg, U.S.A.
Here is my keynote.
Presentation title is “Experimental Identification of Model Parameters and the Statistical Process Using a Nonlinear Oscillator applied to EEG Analysis”
If you want to read it in Japanese, check here.
This presentation wii comprise four section.
First, I will give you a very brief overview of EEG.
Second, I’m going to show you modeling of EEG and analysis way.
Third, Experimental, In this report, we investigate two types of mental condition, relax state and stress state.
Final section is a discussion part.
What is EEG ? Analysis??
What’s EEG?
EEG, stands for electroencephalogram, is a easily way of recordings brain activity.
We can measure these changes in Voltage (±10 ~ 100 micro V) using sensors placed on the scalp.
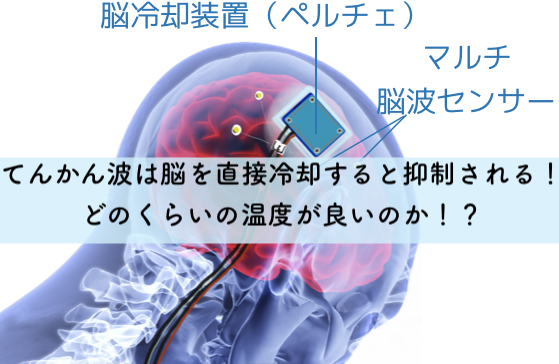
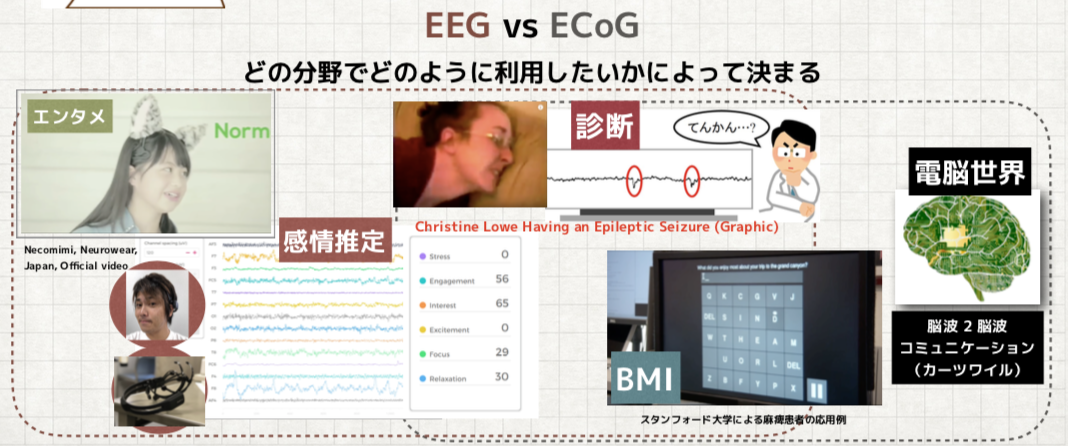
EEG has biological information, that’s the reason why this is useful for diagnosing brain diseases especially epilepsy, for investigating mental activity, sleep cycle and more,,,
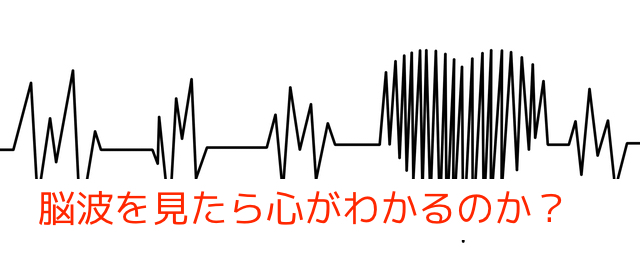
EEG is the good signal for studying human, but important question is How we analyze EEG ??
How analysis ?
In general, FFT analysis is the first step in this bio signal field.
we can see the mental condition by amount of sub-band frequency.
(for example, in relax state, the alpha power increase. in stress state, the beta power increase, something like that)
Yes of corse, FFT is always good tool to see a hiding pattern in signals.
but you know, in EEG analysis, It’s not perfectly.
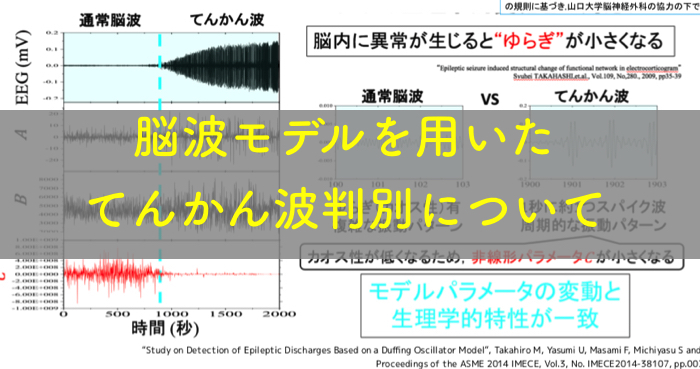
because EEG has a chaos characteristics. so, we have to do “nonlinear analysis” to check human mental condition if we use EEG signal.
For example, we have many types of stress condition, like “concentrating with joy” which means good stress in many cases, or “concentrating being impatience” which is not good stress in many cases, how do you know the difference of the two condition by only FFT analysis ????
I have to say characteristics of EEG signal in nonlinearity.
EEG has a chaos which is mixed “bounded” and “Aperiodic”.
Bounded regularity is like frequency in EEG.
We can see the relationship between the brain activity and mental activity in frequency.
For example, the frequency band increases with stress.
And another characteristics is “Irregularity” which means the same state is not repeated again.
So, chaotic EEG analysis is difficult to analyze, but the quantitative analysis can be performed if the time-series data is below a certain critical time because it fluctuates according to deterministic dynamics.
So, chaotic EEG analysis is difficult to analyze, but the quantitative analysis can be performed if the time-series data is below a certain critical time because it fluctuates according to deterministic dynamics.
Our EEG analysis method
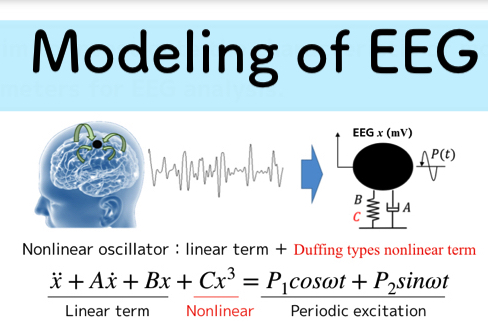
In this study, We propose a EEG analysis model using a nonlinear oscillator with one degree of freedom.
It doesn’t have a random term.
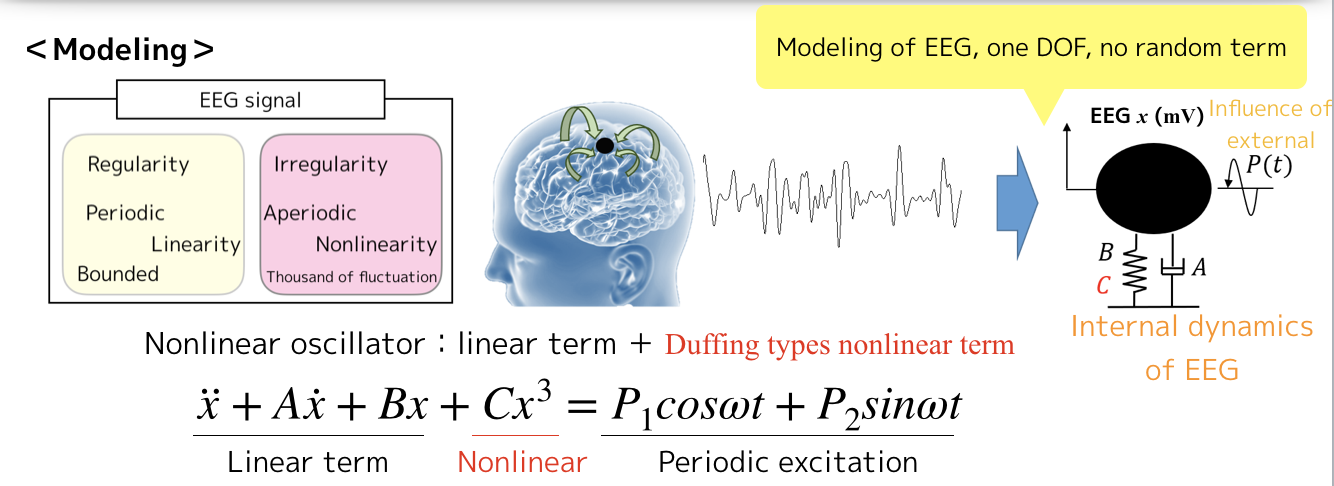
The left hand side of the equation shows the internal dynamics of the EEG at the measurement point where x is the position of the oscillator.
Parameter A is the linear viscosity, parameter B is stiffness coefficient, and parameter C is the nonlinear stiffness coefficient.
On the right hand side, the influence of external EEG is expressed as periodic excitation.
These two parameter P1 and P2 are the amplitude, and w is the angular frequency.
Our study method identifies six model parameters experimentally.
Result & Discussion
if you want know the analysis way.
you can watch my “Slideshare”.
This is a analysis result and short discussion.
here is the result of parameter identification.
I’m showing these parameters on 3d graphs and you can see correlation relationships between each parameters.
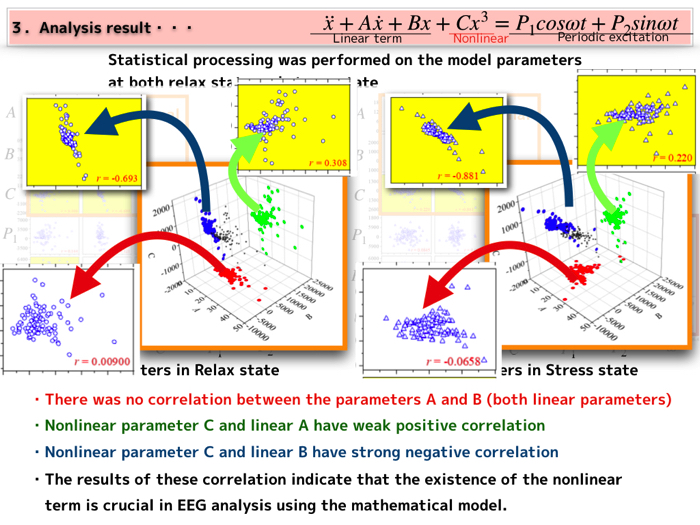
These results are common tendency for both relax state and stress state.
That is, when the parameter C increases any state, the parameters included in each linear term are affected.
In particular, parameter A slightly increases and parameter B greatly decreases.
The results of these correlation indicate that the existence of the nonlinear term is crucial in EEG analysis using the mathematical model.
These experimentally identified parameter maps can be useful tools as a way to visualize the state of EEG in the future.