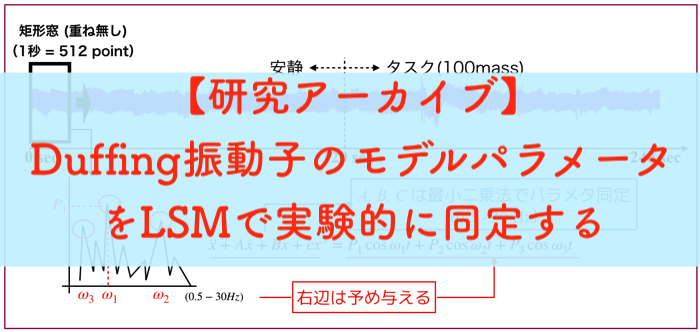
この記事はあんまり意味のないものですが,自分の研究アーカイブ用に残して置きます.
非線形振動子の一つであるDuffing振動子のパラメータを実験的に推定するために,これまで遺伝的アルゴリズムやダウンヒルシンプレックスなどの最適化手法を用いていましたが,今回は最小二乗法でパパッと簡単に同定します.
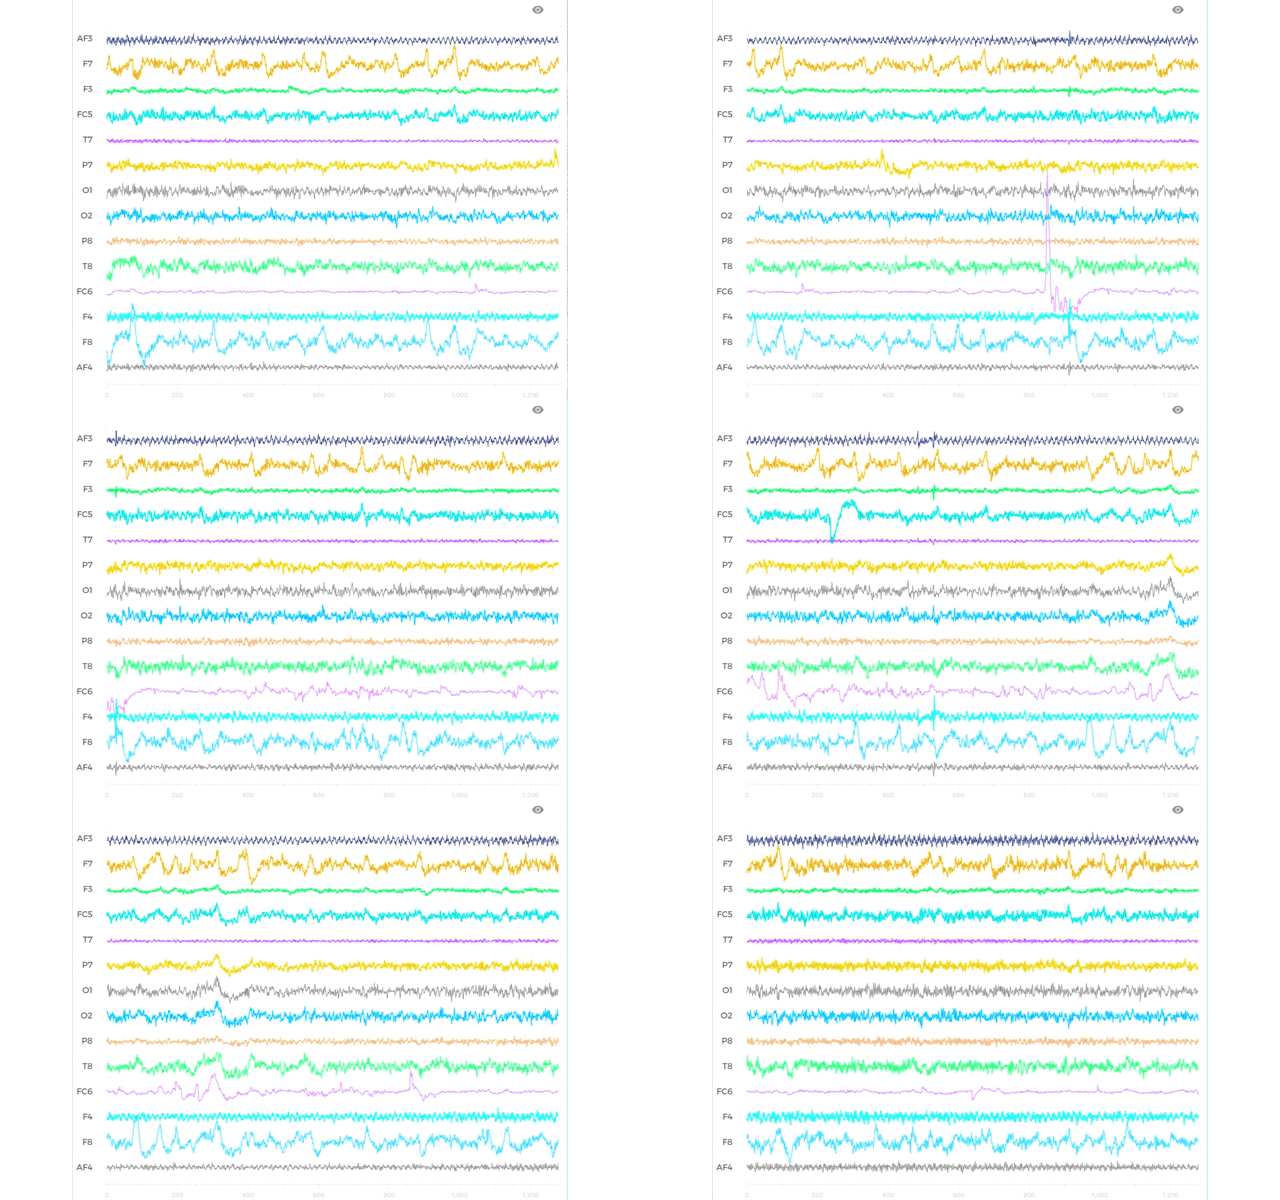
ちなみに実験値にはヒト脳波(N=4)を計測したものを使いました.
下の絵のような感じです.
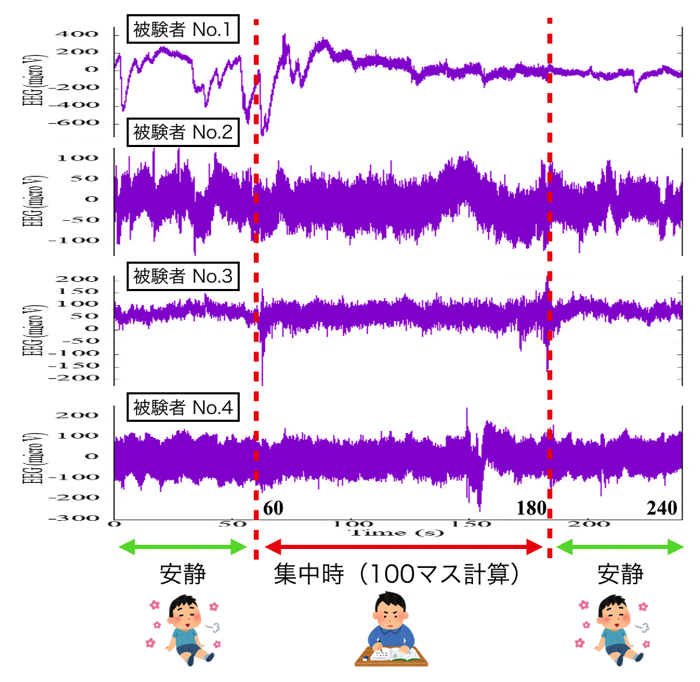
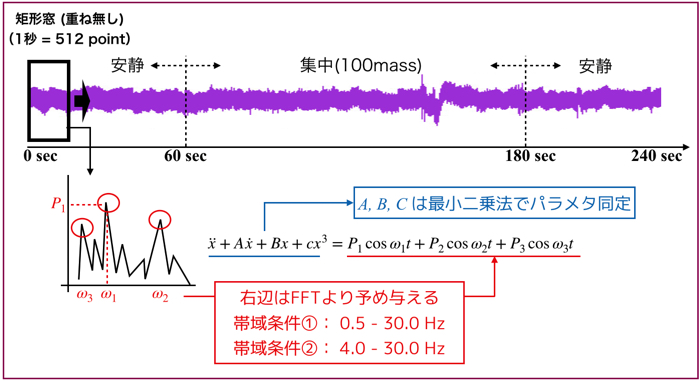
脳波データは,「1分間安静+2分間集中(100マス計算)+1分間安静」を行った際の実験結果です.
後頭部のO1という箇所の脳波を取得しました.
実験自体は別に本質的なものではない(時系列データがほしかっただけ)なので,具体的記述は避けます.
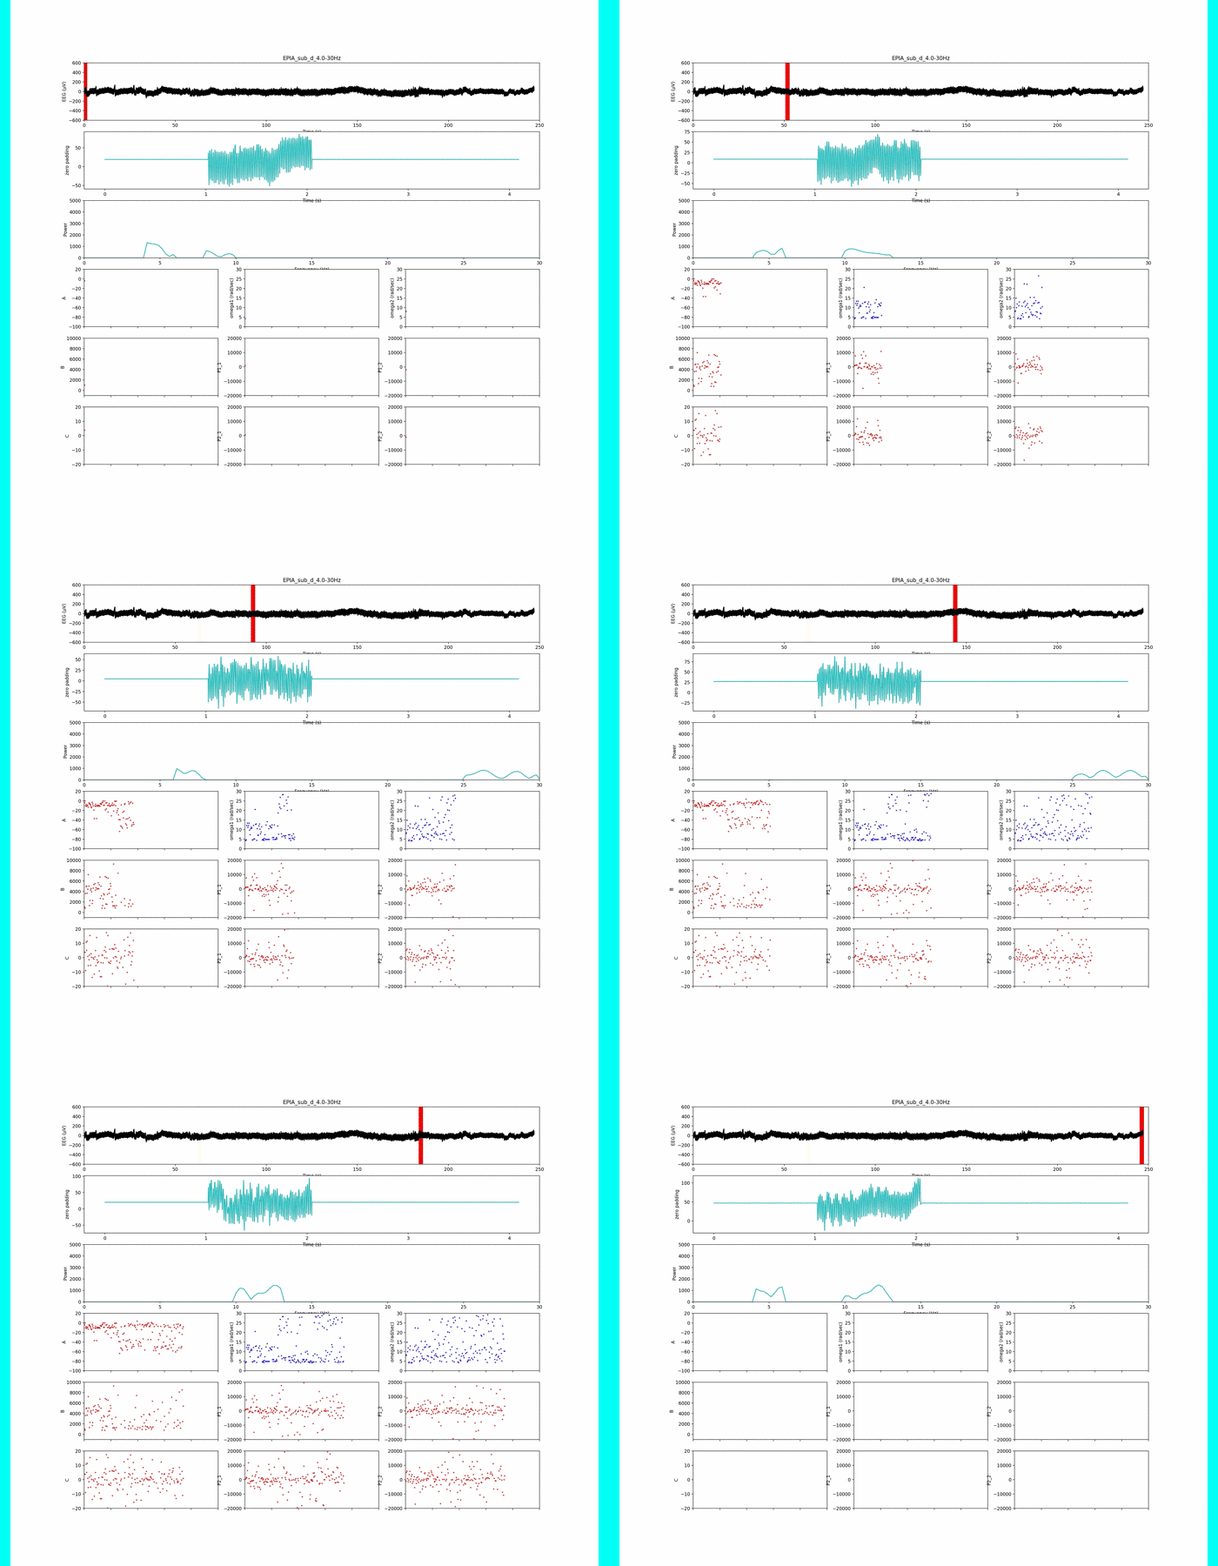
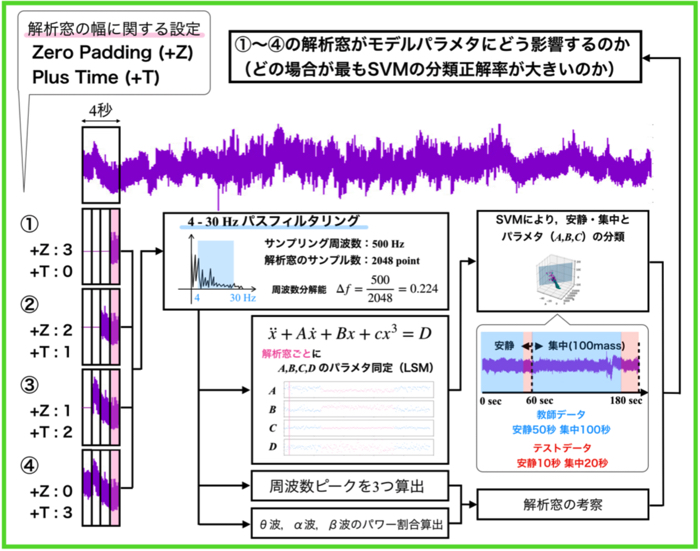
その生実験データに対して1秒間の解析ウインドウ毎に「FFT+peak周波数取得+パラメータ同定」を行います.
時間周波数解析ですね.
(参考;「時間周波数分析とは!?」)
ウインドウサイズや,モデルの構造などはとりあえず後回しで,一連の動作が上手く行われているのか,テスト的にやっています.
解析プログラムは以下です.今回はPythonで実装しました.
(解析はとりあえず回れば良い派なのでコード美学はご了承願います!)
解析する帯域は4~30 Hzです.
1 2 3 4 5 6 7 8 9 10 11 12 13 14 15 16 17 18 19 20 21 22 23 24 25 26 27 28 29 30 31 32 33 34 35 36 37 38 39 40 41 42 43 44 45 46 47 48 49 50 51 52 53 54 55 56 57 58 59 60 61 62 63 64 65 66 67 68 69 70 71 72 73 74 75 76 77 78 79 80 81 82 83 84 85 86 87 88 89 90 91 92 93 94 95 96 97 98 99 100 101 102 103 104 105 106 107 108 109 110 111 112 113 114 115 116 117 118 119 120 121 122 123 124 125 126 127 128 129 130 131 132 133 134 135 136 137 138 139 140 141 142 143 144 145 146 147 148 149 150 151 152 153 154 155 156 157 158 159 160 161 162 163 164 165 166 167 168 169 170 171 172 173 174 175 176 177 178 179 180 181 182 183 184 185 186 187 | # -*- coding: utf-8 -*- import csv import scipy.signal as sps from scipy.optimize import leastsq import numpy as np import matplotlib.pyplot as plt N = 512 # サンプル数 dt = 0.002 # サンプリング間隔 p_max = 30.000000 p_min = 4.00000 inputData = 'exp.txt' outputData = 'parameters_a_100mass.txt' ifftData = 'ifft_a_100mass.txt' eeg = list() i_eeg = list() t = list() xd = list() xdd = list() w = list() p = list() ieeg = list() def fft_peak(t, eeg): peak_idx = list() # データのパラメータ #t = np.arange(0, N*dt, dt) # 時間軸 freq = np.linspace(0, 1.0/dt, N) # 周波数軸 # 高速フーリエ変換 F = np.fft.fft(eeg) Power = F.copy() # 振幅スペクトルを計算 Power = np.abs(Power) # 振幅を元の信号のスケールに揃える Power = Power / (N/2) # 交流成分 Power[0] = Power[0] / 2 # 直流成分 F2 = F.copy() F2 = F2 / (N/2) # 交流成分 F2[0] = F2[0] / 2 # 直流成分 # FFTデータからピークを自動検出 peak_idx = sps.argrelmax(Power, order=1)[0] # ピーク(極大値)のインデックス取得 # ピーク検出感度調整もどき、後半側(ナイキスト超)と閾値より小さい振幅ピークを除外 peak_cut = 0.1 # ピーク閾値 peak_idx = peak_idx[(Power[peak_idx] > peak_cut) & (peak_idx >= p_min) & (peak_idx <= p_max)] selected_peakPower = dict(zip(freq[peak_idx], Power[peak_idx])) peak = dict(sorted(selected_peakPower.items(), key=lambda x:x[1], reverse=True)) p = list(peak.values()) p = list(map(float, p)) f = list(peak.keys()) f = list(map(float, f)) del f[3:] del p[3:] # w = 2.0 * np.pi * f w = f w = [i*2.0*np.pi for i in w] #ローパスフィルタ F2[(freq > p_max)] = 0.0 #ハイパスフィルタ F2[(freq < p_min)] = 0.0 #逆高速フーリエ変換 i_eeg = np.fft.ifft(F2) i_eeg = np.real(i_eeg*N) # グラフ表示 # plt.figure() # plt.rcParams['font.family'] = 'Times New Roman' # plt.rcParams['font.size'] = 17 # plt.subplot(121) # plt.plot(t[:], eeg[:], label='f(n)') # plt.xlabel("Time", fontsize=20) # plt.ylabel("raw_Signal", fontsize=20) # plt.grid() # leg = plt.legend(loc=1, fontsize=25) # leg.get_frame().set_alpha(1) # plt.subplot(122) # plt.plot(t[:], i_eeg[:], label='|F(k)|') # plt.xlabel("Time", fontsize=20) # plt.ylabel("ifft_Signal", fontsize=20) # plt.grid() # leg = plt.legend(loc=1, fontsize=25) # leg.get_frame().set_alpha(1) # plt.show() # # グラフ表示 # plt.figure() # plt.rcParams['font.family'] = 'Times New Roman' # plt.rcParams['font.size'] = 17 # plt.subplot(121) # plt.plot(freq[:35], F[:35], label='f(n)') # plt.xlabel('Frequency', fontsize=20) # plt.ylabel('Amplitude(beforeBPF)', fontsize=20) # plt.grid() # leg = plt.legend(loc=1, fontsize=25) # leg.get_frame().set_alpha(1) # plt.subplot(122) # plt.plot(freq[:35], F2[:35], label='|F(k)|') # plt.xlabel('Frequency', fontsize=20) # plt.ylabel('Amplitude(afterBPF)', fontsize=20) # plt.grid() # leg = plt.legend(loc=1, fontsize=25) # leg.get_frame().set_alpha(1) # plt.show() return(w, p, i_eeg) def p_cal(p): p_sum = p[0]+p[1]+p[2] p[0] = p[0]/p_sum#*p_sum p[1] = p[1]/p_sum#*p_sum p[2] = p[2]/p_sum#*p_sum return p def cal(t, x): j = 0 x = list(x) xd.append(float((x[j+1] - x[j])/dt)) #xd[0] j+=1 for j in range(N-1): xd.append(float((x[j+1] - x[j])/dt))#xd[1] xdd.append(float((xd[j] - xd[j-1])/dt))#xdd[0] t.pop() x.pop() xd.pop() return (t,x) def func3(param, t, x, xd, xdd): residual = xdd + (param[0]*xd + param[1]*x + param[2]*x*x*x - p[0]*np.cos(w[0]*t)- p[1]*np.cos(w[1]*t)- p[2]*np.cos(w[2]*t)) return residual def lsm(t, x, xd, xdd): para = [0., 0., 0.] #para = [0, 0, 0, 0] t = np.array(t) x = np.array(x) xd = np.array(xd) xdd = np.array(xdd) params = leastsq(func3, para, args=(t, x, xd, xdd)) return params with open(outputData, mode='w') as OutputFile: with open(inputData, 'r') as InputFile: reader = csv.reader(InputFile, delimiter='\t') i = 0 z = 0 for row in reader: t.append(float(row[0])) eeg.append(float(row[1])) # print("{:d}".format(i)) # print("{:f}\t{:f}".format(float(row[0]), float(row[1]))) if(((i+1)%N==0) & (i>1)): print("fft_start") w, p, i_eeg = fft_peak(t, eeg) ieeg.extend(i_eeg) print(w) print(p) #p = p_cal(p) t, i_eeg = cal(t, i_eeg) Result = lsm(t, i_eeg, xd, xdd) print(Result) OutputFile.write("{:.3f}\t{:.6f}\t{:.6f}\t{:.6f}\t{:.6f}\t{:.6f}\t{:.6f}\t{:.6f}\t{:.6f}\t{:.6f}\t{:.6f}\t{:.6f}\t{:.6f}\n".format(0.510+z*dt*N,Result[0][0],Result[0][1],Result[0][2],p[0],w[0],0.0,p[1],w[1],0.0,p[2],w[2],0.0)) print("xdd + {:.6f}xd + {:.6f}x + {:.6f}x*x*x - {:.6f}cos({:.6f}t - {:.6f}) - {:.6f}cos({:.6f}t - {:.6f}) - {:.6f}cos({:.6f}t - {:.6f})\n".format(Result[0][0],Result[0][1],Result[0][2],p[0],w[0],0.0,p[1],w[1],0.0,p[2],w[2],0.0)) z+=1 eeg = list() i_eeg = list() t = list() xd = list() xdd = list() # if(i > 1538): # break i+=1 ieeg = map(str,ieeg) textdata = '\n'.join(ieeg) with open(ifftData, 'wt') as f: f.write(textdata) # next(reader) |
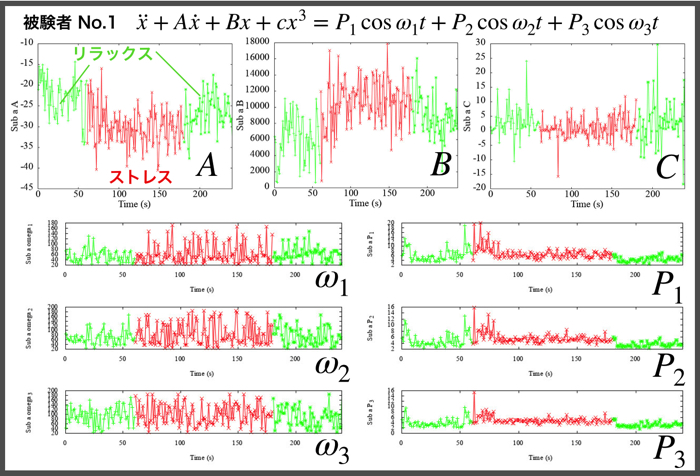
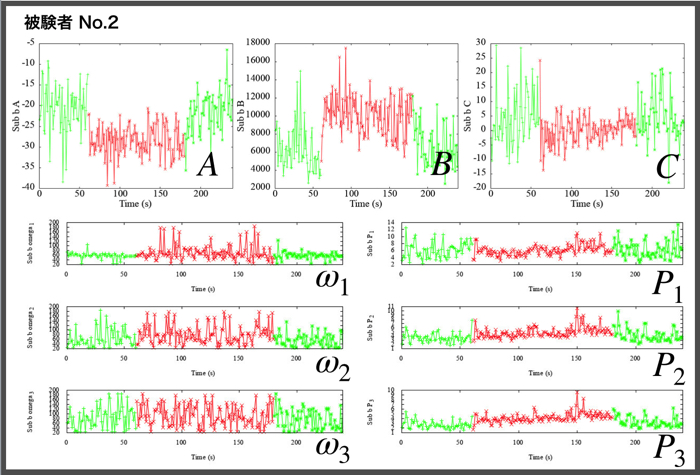
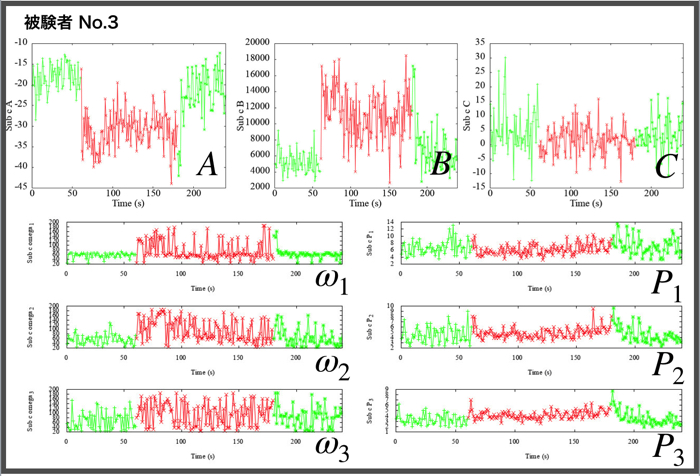
解析に使用した実験データや,適当にプログラムを回して得られる結果など貼って置きます.
各被験者(N=4)ごとの安静時120秒分と集中時120秒分のパラメータ同定結果です.
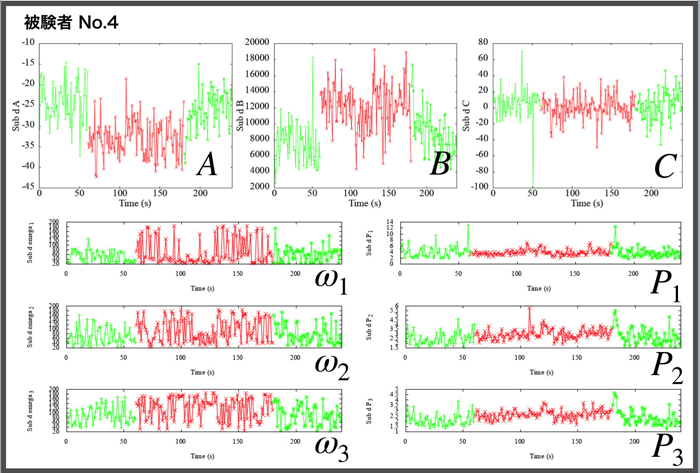
相関をみるために,各パラメータ同士のプロットをgnuplotで行います.
テンプレート貼っておきます(自分用ですが,,,)
1 2 3 4 5 6 7 8 9 10 11 12 13 14 15 16 17 18 19 20 21 22 23 24 25 26 27 28 29 30 31 32 33 34 35 36 37 38 39 40 41 42 43 44 45 46 47 48 49 50 | #parameter A-B set xlabel font "Times New Roman, 20" set xtics font "Times New Roman, 20" set ylabel font "Times New Roman, 20" set ytics font "Times New Roman, 20" set ylabel "Parameter B" set xlabel "Parameter A" unset xrange unset yrange set key font "Times New Roman, 20" unset key plot "a_relax1.txt" u 2:3 w p lc rgb "green", "a_stress.txt" u 2:3 w p lc rgb "red","a_relax2.txt" u 2:3 w p lc rgb "green" set term jpeg set out "Sub_a_A-B_2.jpg" replot set term aqua #parameter A-C set xlabel font "Times New Roman, 20" set xtics font "Times New Roman, 20" set ylabel font "Times New Roman, 20" set ytics font "Times New Roman, 20" set ylabel "Parameter C" set xlabel "Parameter A" unset xrange unset yrange set key font "Times New Roman, 20" unset key plot "a_relax1.txt" u 2:4 w p lc rgb "green", "a_stress.txt" u 2:4 w p lc rgb "red","a_relax2.txt" u 2:4 w p lc rgb "green" set term jpeg set out "Sub_a_A-C_2.jpg" replot set term aqua #parameter B-C set xlabel font "Times New Roman, 20" set xtics font "Times New Roman, 20" set ylabel font "Times New Roman, 20" set ytics font "Times New Roman, 20" set ylabel "Parameter C" set xlabel "Parameter B" unset xrange unset yrange set key font "Times New Roman, 20" unset key plot "a_relax1.txt" u 3:4 w p lc rgb "green", "a_stress.txt" u 3:4 w p lc rgb "red","a_relax2.txt" u 3:4 w p lc rgb "green" set term jpeg set out "Sub_a_B-C_2.jpg" replot set term aqua |
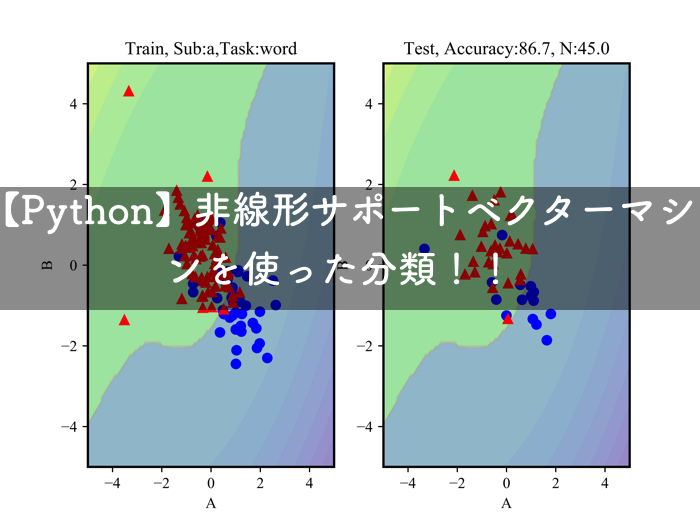
被験者ごとの各パラメータ(A,B,C)の相関も貼っておきます.


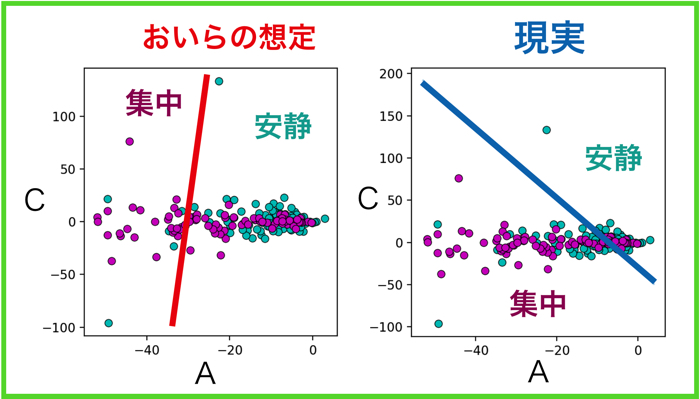
この相関によって,ヒト毎の集中度合いが把握できたら良いですけど,まだまだ最適化が必要です.
例えば
- FFTで検討する帯域
- モデルこれで良いのか
- Running windowどうするか
などなど,
考えたら付きませんが,とりあえずは以上です.
追記
ちなみに,以上のデータは4~30 Hzの解析データですが,0.5~30 Hzを含んだデータも置いときます.
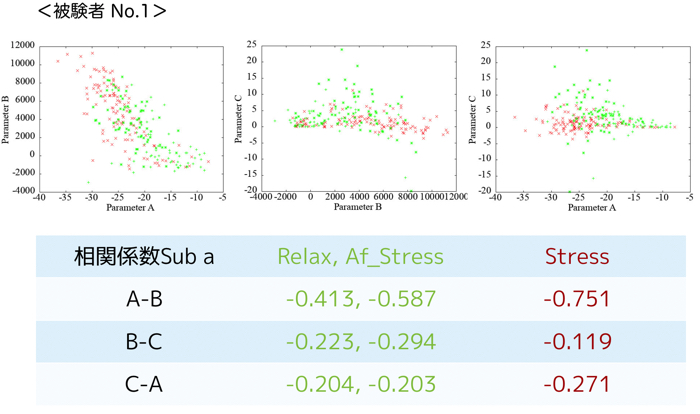
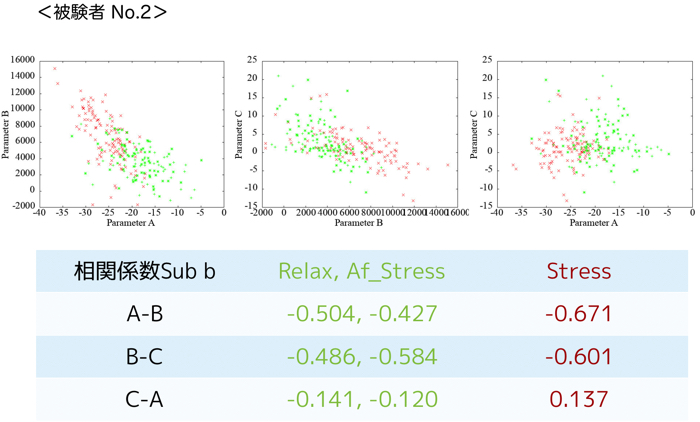
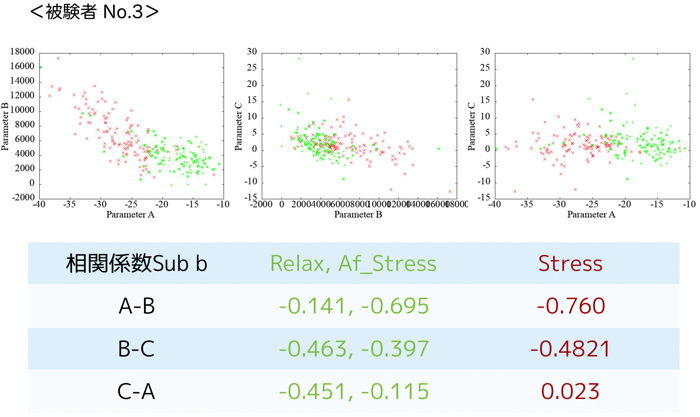
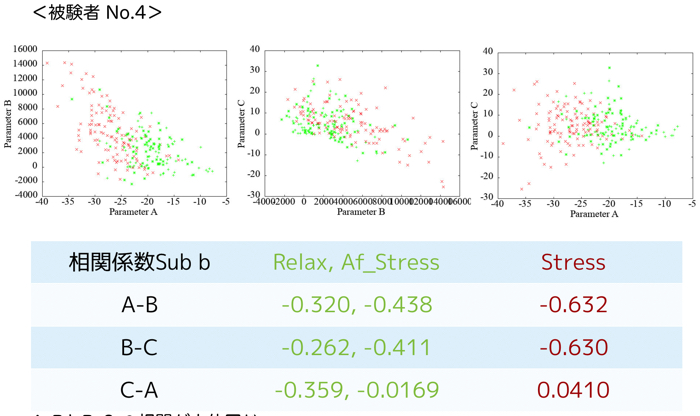
相関値も出しましたが,ここから特徴抽出が大変です.
個人的な見解としては,パラメタAとBの相関値が負に大きすぎて,納得がいっていないのです...笑
もっと相関が出なくなるような(←何言っているんだコイツ)パラメタ同定ができないか考え中です.
ではー!


