この記事は,脳波からヒトの状態推定を可能にするモデルをどうにか作りたくて獅子奮闘している研究アーカイブ(自分用)です.
前回の記事はこちら.
(参考:「最小二乗法によるパラメータ同定奮闘記1」)
最小二乗法は演算処理にかかるコストがめちゃくちゃ低いので,パラメータ同定にかかる時間がかなり早いので使い勝手が良いです.
プログラムも組みやすいし,かなりメジャーなアルゴリズムなので説明コストも低いのが嬉しい.
具体的な内容をさらっと書くと,
脳波の持つ非線形性を,どうにか数値化できるようにするために非線形振動子によるモデリングを行なっています.
扱う非線形振動子は,1自由度系なので直感的に理解し易いです.
さてさて,前回の記事を読んでいただければ話は早いのですが,あまりうまくいかなかったので,パラメタ同定に工夫を入れます.
以下のように修正します.
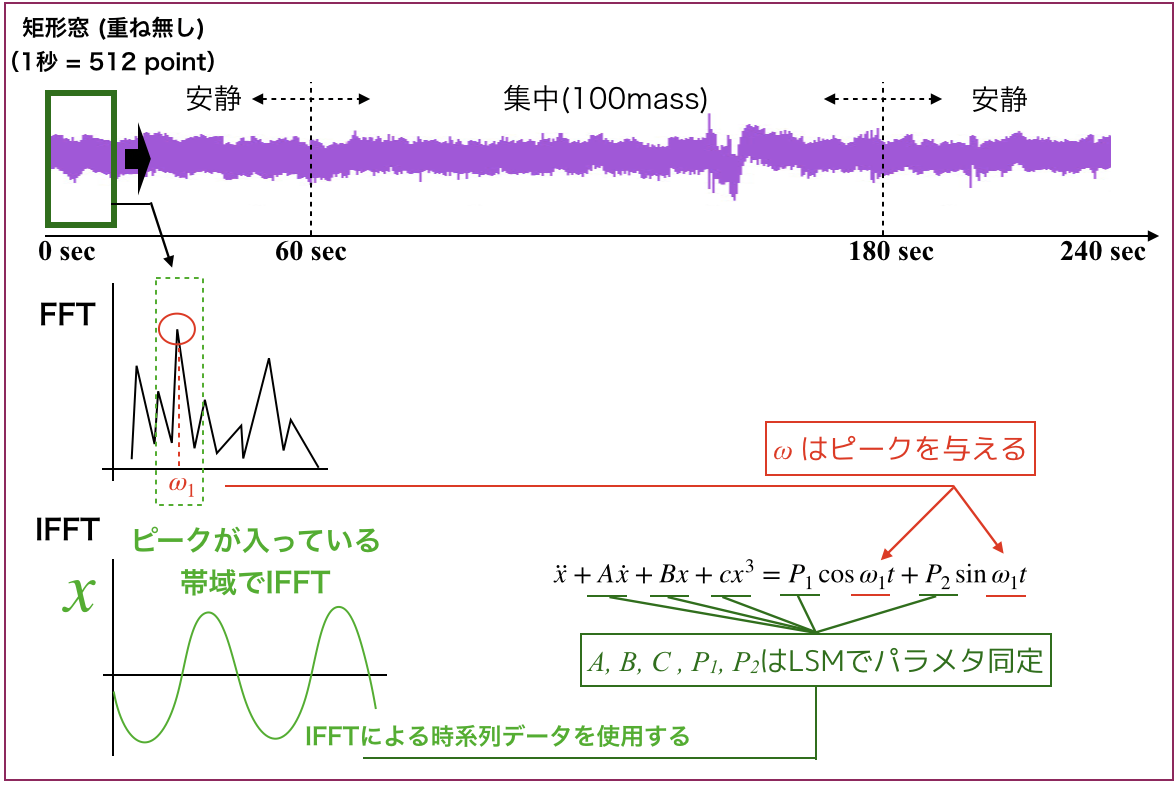
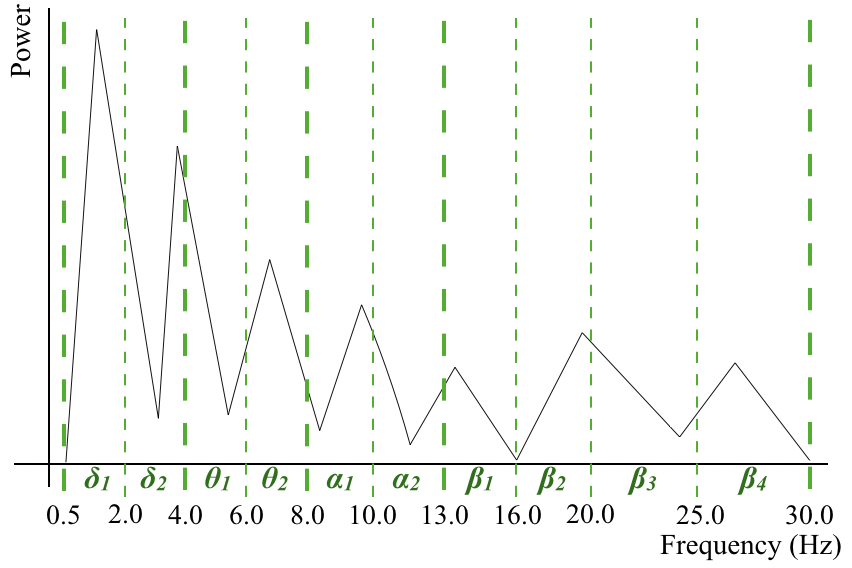
修正の内容としては,
- Running window内でFFT
- ピークを1つ決める
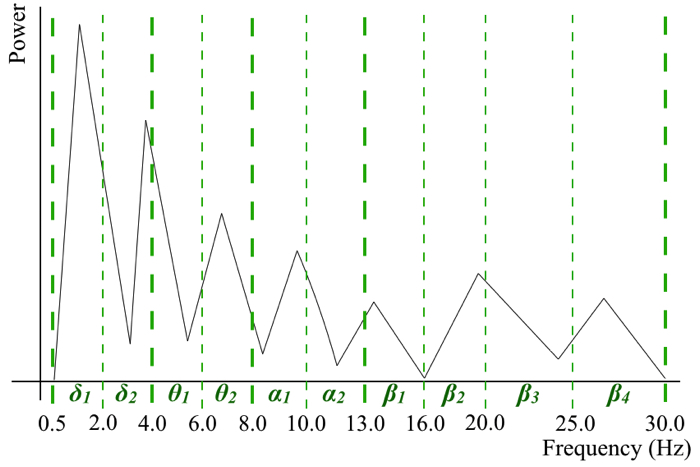
- 周波数帯域を上図に示すように分けておいて,ピークが属する帯域でIFFT
- IFFTで得た1秒間の時系列波形を用いてパラメタ同定
- モデル右辺の振動数はピークを与える
的な内容です.
ここ周波数帯域の説明を再度付け加えておくと,以下のような10つの帯域に分けてます.
- δ1 (0.5 – 2 Hz)
- δ1 (2 – 4 Hz)
- θ1 (4 – 6 Hz)
- θ2 (6 – 8 Hz)
- α1 (8 – 10 Hz)
- α2 (10 – 13 Hz)
- β1 (13 – 16 Hz)
- β2 (16 – 20 Hz)
- β3 (20 -25 Hz)
- β4 (25 – 30 Hz)
としました.
なので,IFFTを回した結果は,1秒 (512Hz)ごとにこうなります.
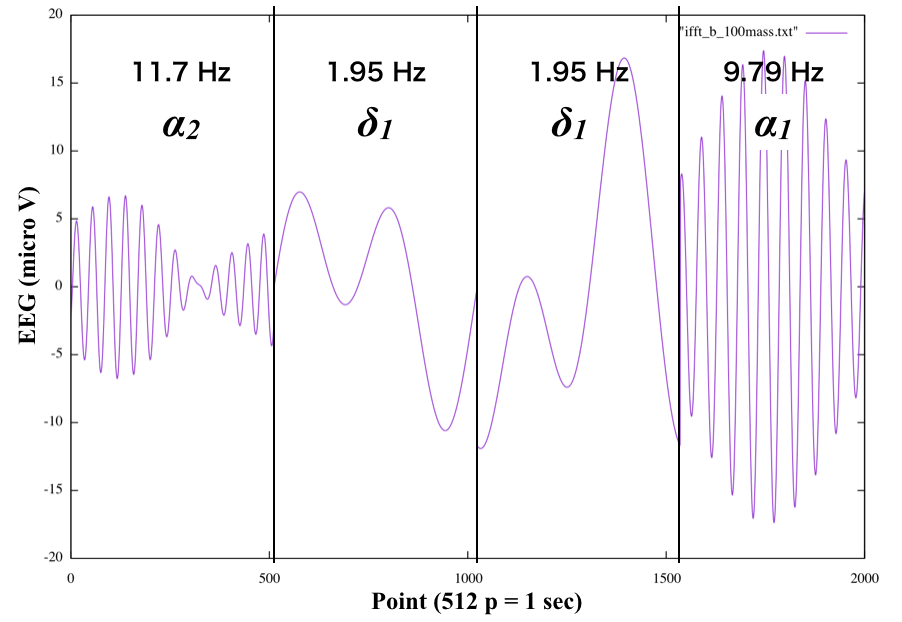 上の図は4秒間の一例ですが,本当は被験者ごとに240秒間あります.
1秒ごとの支配的な周波数帯域によるIFFT結果です.
今回は,このIFFT結果を用いてパラメタ同定を行ってみました.
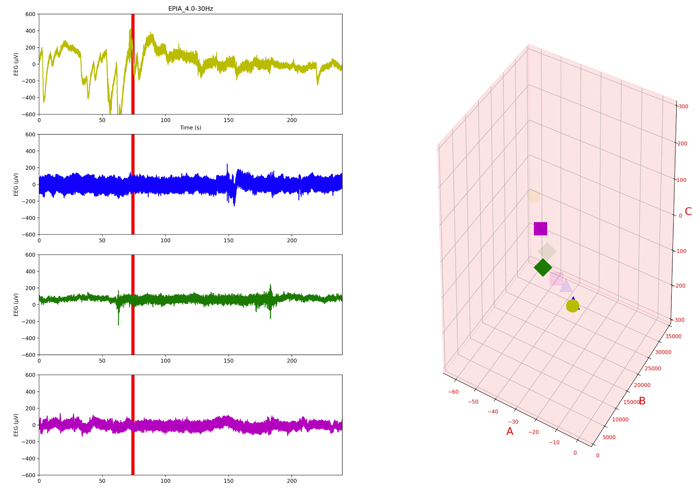
被験者aだけの結果を一例として示します.
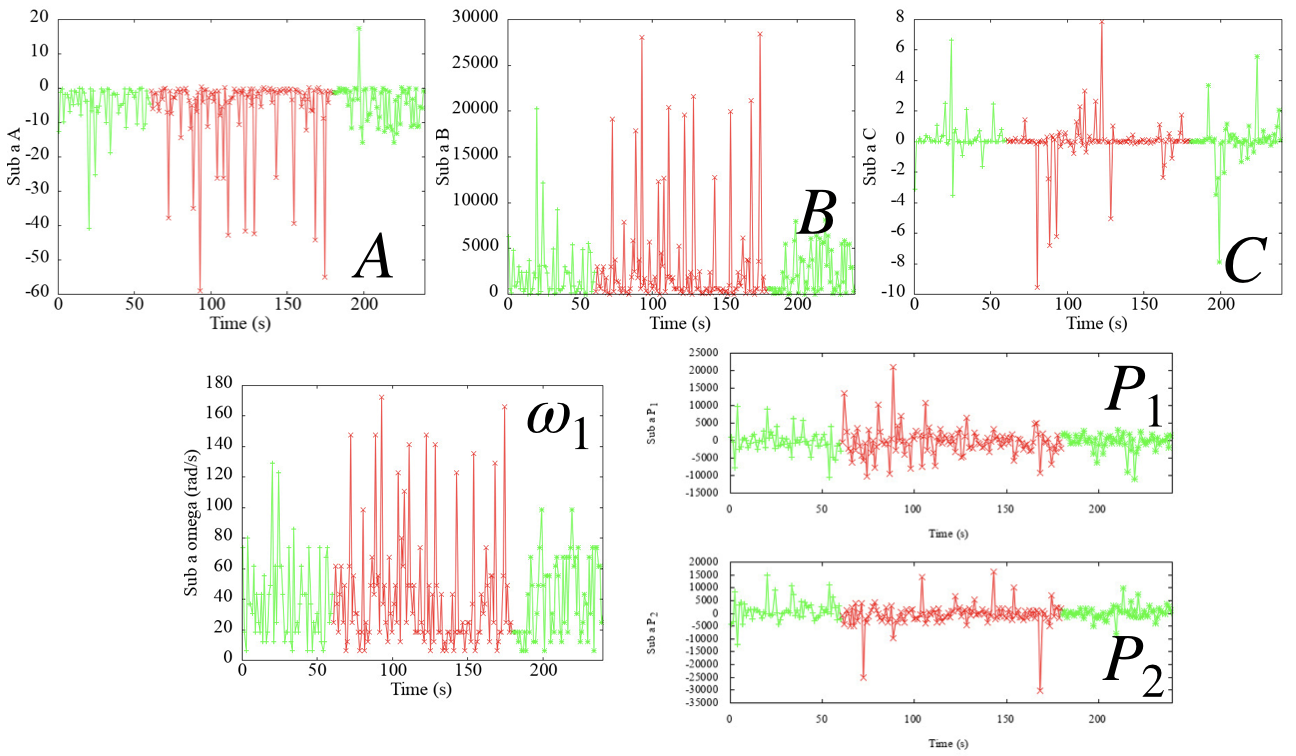
各パラメタの集中度の特徴が際立ったような気もしてます.
(赤が集中状態,緑が安静状態)
また,被験者ごとの各パラメタ値の相関に関しては,以下のような結果になりました.
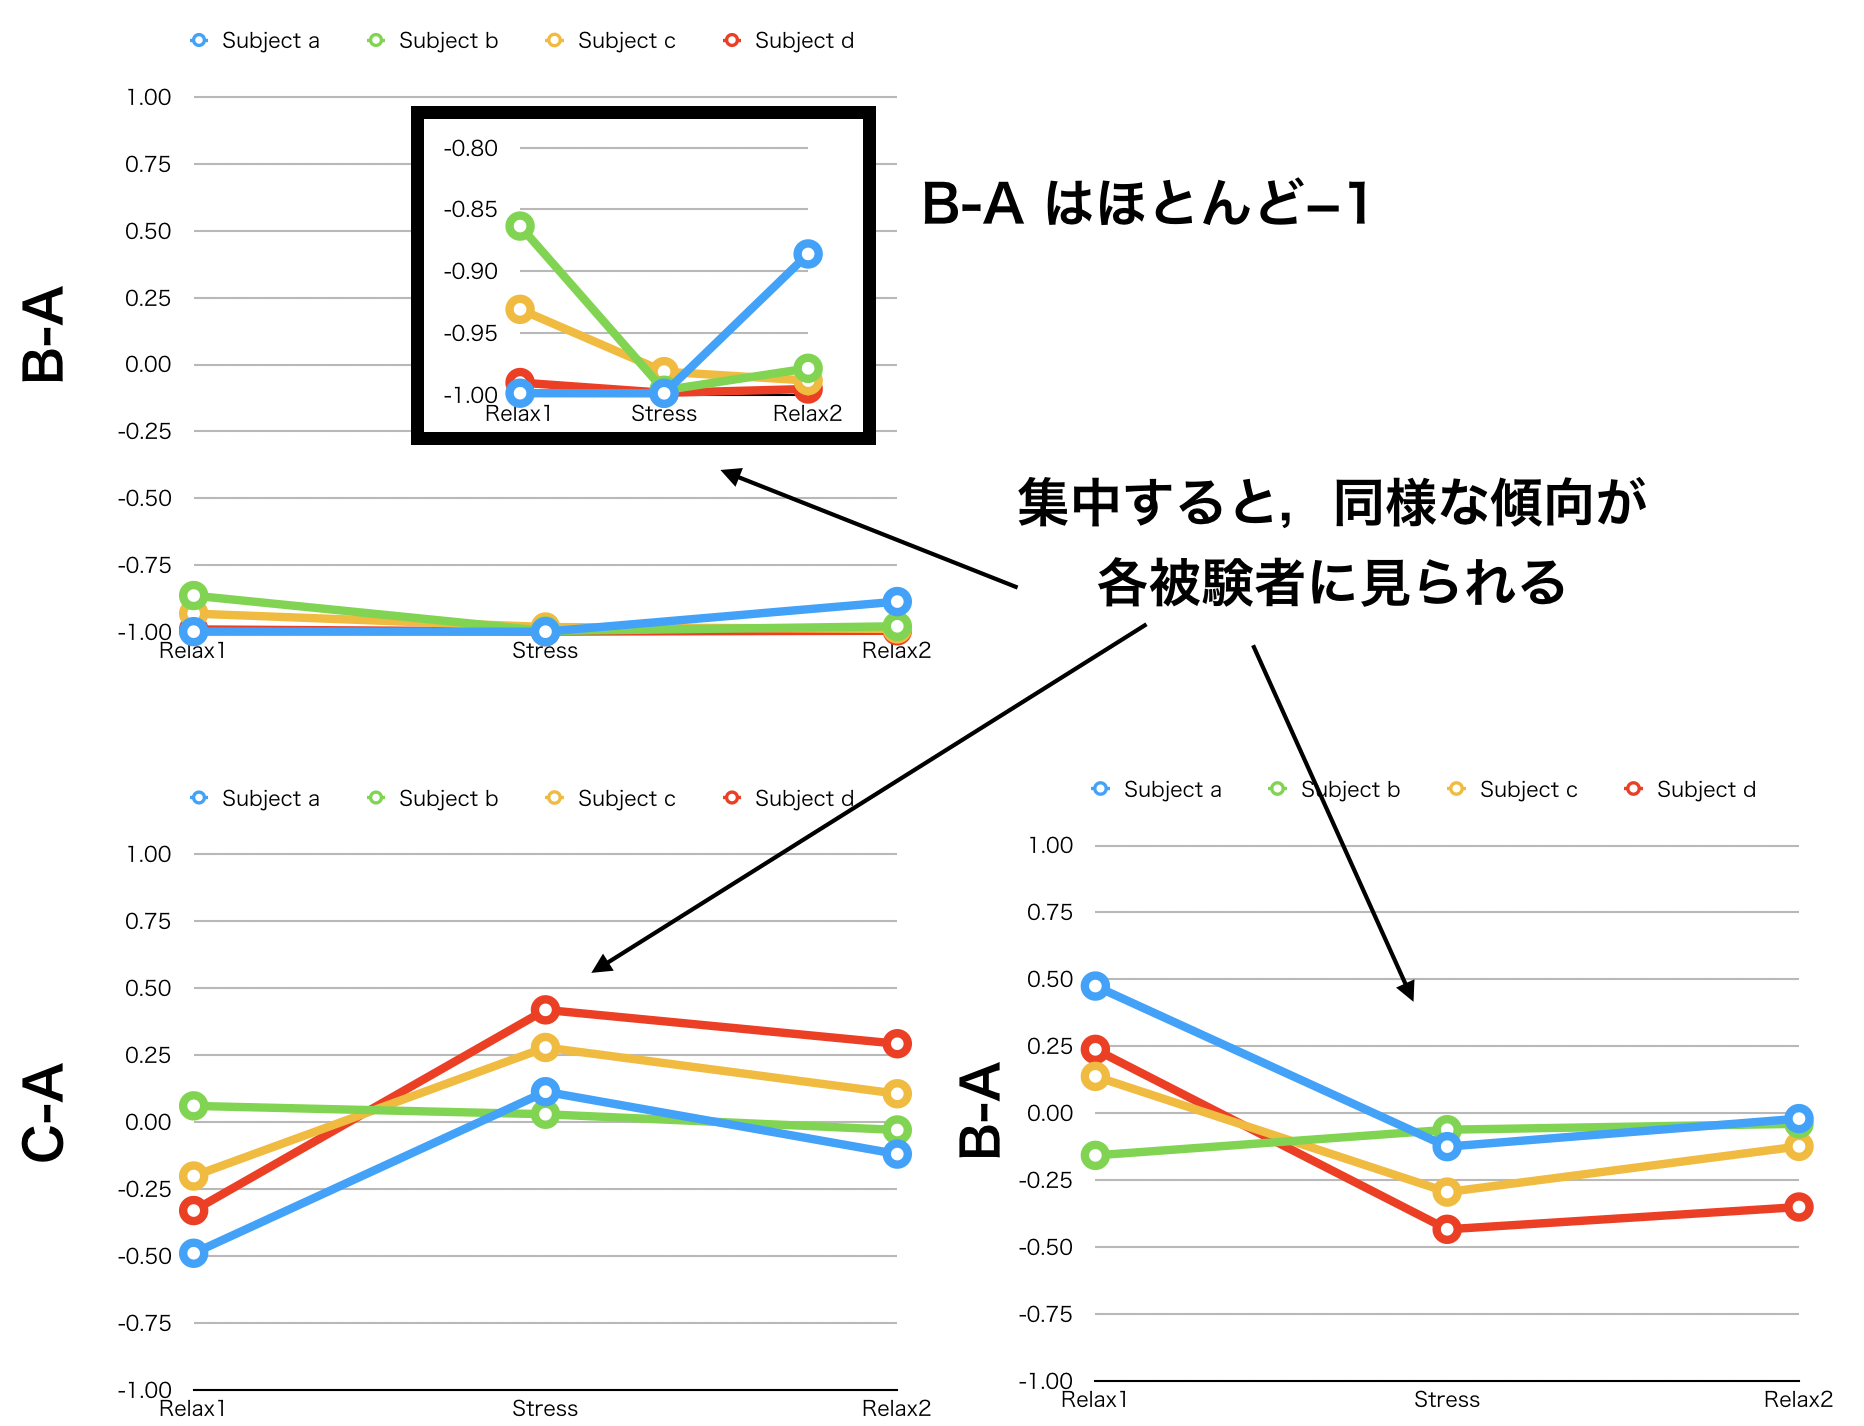
このような結果になりました.
相変わらず線形性強度を示すパラメタA,Bは高い相関を示しているのが悔しいです.
まだまだ対応策を考えていきます.
周波数分解能をあげるか,モデルに与えるピークの数を増やすことで再度修正する方向を考えています.
以下はPythonプログラム
1 2 3 4 5 6 7 8 9 10 11 12 13 14 15 16 17 18 19 20 21 22 23 24 25 26 27 28 29 30 31 32 33 34 35 36 37 38 39 40 41 42 43 44 45 46 47 48 49 50 51 52 53 54 55 56 57 58 59 60 61 62 63 64 65 66 67 68 69 70 71 72 73 74 75 76 77 78 79 80 81 82 83 84 85 86 87 88 89 90 91 92 93 94 95 96 97 98 99 100 101 102 103 104 105 106 107 108 109 110 111 112 113 114 115 116 117 118 119 120 121 122 123 124 125 126 127 128 129 130 131 132 133 134 135 136 137 138 139 140 141 142 143 144 145 146 147 148 149 150 151 152 153 154 155 156 157 158 159 160 161 162 163 164 165 166 167 168 169 170 171 172 173 174 175 176 177 178 179 180 181 182 183 184 185 186 187 188 189 190 191 192 193 194 195 196 197 198 199 200 201 202 203 204 205 206 207 208 209 210 211 212 213 214 215 216 217 218 219 220 221 222 223 224 225 | # -*- coding: utf-8 -*- import csv import scipy.signal as sps from scipy.optimize import leastsq import numpy as np import matplotlib.pyplot as plt N = 512 # サンプル数 dt = 0.002 # サンプリング間隔 p_max = 30.000000 p_min = 0.500000 p_band = 1.00000 delta_bound, theta_min, theta_bound, alpha_min, alpha_bound, beta_min, beta_bound1, beta_bound2, beta_bound3 = 2.0, 4.0, 6.0, 8.0, 10.0, 13.0, 16.0, 20.0, 25.0 inputData = 'exp.txt' outputData = 'peak_band/parameters_d_100mass.txt' ifftData = 'peak_band/ifft_d_100mass.txt' eeg = list() i_eeg = list() t = list() xd = list() xdd = list() w = list() p = list() ieeg = list() def fft_peak(t, eeg): peak_idx = list() # データのパラメータ #t = np.arange(0, N*dt, dt) # 時間軸 freq = np.linspace(0, 1.0/dt, N) # 周波数軸 # 高速フーリエ変換 F = np.fft.fft(eeg) Power = F.copy() # 振幅スペクトルを計算 Power = np.abs(Power) # 振幅を元の信号のスケールに揃える Power = Power / (N/2) # 交流成分 Power[0] = Power[0] / 2 # 直流成分 F2 = F.copy() F2 = F2 / (N/2) # 交流成分 F2[0] = F2[0] / 2 # 直流成分 # FFTデータからピークを自動検出 peak_idx = sps.argrelmax(Power, order=1)[0] # ピーク(極大値)のインデックス取得 # ピーク検出感度調整もどき、後半側(ナイキスト超)と閾値より小さい振幅ピークを除外 peak_cut = 0.1 # ピーク閾値 peak_idx = peak_idx[(Power[peak_idx] > peak_cut) & (peak_idx >= p_min) & (peak_idx <= p_max)] selected_peakPower = dict(zip(freq[peak_idx], Power[peak_idx])) peak = dict(sorted(selected_peakPower.items(), key=lambda x:x[1], reverse=True)) # p = list(peak.values()) # p = list(map(float, p)) f = list(peak.keys()) f = list(map(float, f)) del f[1:] print(f[0]) #p_min <= f[0] < delta_bound if((f[0] >= p_min) & (f[0] < delta_bound)): p_min2 = p_min p_max2 = delta_bound #delta_bound <= f[0] < theta_min elif((f[0] >= delta_bound) & (f[0] < theta_min)): p_min2 = delta_bound p_max2 = theta_min #theta_min <= f[0] < theta_bound elif((f[0] >= theta_min) & (f[0] < theta_bound)): p_min2 = theta_min p_max2 = theta_bound #theta_bound <= f[0] < alpha_min elif((f[0] >= theta_bound)&(f[0] < alpha_min)): p_min2 = theta_bound p_max2 = alpha_min #alpha_min <= f[0] < alpha_bound elif((f[0] >= alpha_min)&(f[0] < alpha_bound)): p_min2 = alpha_min p_max2 = alpha_bound #alpha_bound <= f[0] < beta_min elif((f[0] >= alpha_bound)&(f[0] < beta_min)): p_min2 = alpha_bound p_max2 = beta_min #beta_min <= f[0] < beta_bound1 elif((f[0] >= beta_min)&(f[0] < beta_bound1)): p_min2 = beta_min p_max2 = beta_bound1 #beta_bound1 <= f[0] < beta_bound2 elif((f[0] >= beta_bound1)&(f[0] < beta_bound2)): p_min2 = beta_bound1 p_max2 = beta_bound2 #beta_bound2 <= f[0] < beta_bound3 elif((f[0] >= beta_bound2)&(f[0] < beta_bound3)): p_min2 = beta_bound2 p_max2 = beta_bound3 #beta_bound3 <= f[0] <= p_max elif((f[0] >= beta_bound3) & (f[0] <= p_max)): p_min2 = beta_bound3 p_max2 = p_max # p_max2 = f[0] + p_band # p_min2 = f[0] - p_band # del p[2:] # w = 2.0 * np.pi * f w = f w = [i*2.0*np.pi for i in w] #ローパスフィルタ F2[(freq > p_max2)] = 0.0 #ハイパスフィルタ F2[(freq < p_min2)] = 0.0 #逆高速フーリエ変換 i_eeg = np.fft.ifft(F2) i_eeg = np.real(i_eeg*N) # グラフ表示 plt.figure() plt.rcParams['font.family'] = 'Times New Roman' plt.rcParams['font.size'] = 17 plt.subplot(311) plt.plot(t[:], eeg[:], label='f(n)') plt.xlabel("Time", fontsize=20) plt.ylabel("raw_Signal", fontsize=20) plt.grid() leg = plt.legend(loc=1, fontsize=25) leg.get_frame().set_alpha(1) plt.subplot(312) plt.xlim([0,30]) plt.plot(freq[:250], F2[:250], label='|F(k)|') plt.xlabel('Frequency', fontsize=20) plt.ylabel('Amplitude(afterBPF)', fontsize=20) plt.grid() leg = plt.legend(loc=1, fontsize=25) leg.get_frame().set_alpha(1) plt.subplot(313) plt.plot(t[:], i_eeg[:], label='|F(k)|') plt.xlabel("Time", fontsize=20) plt.ylabel("ifft_Signal", fontsize=20) plt.grid() leg = plt.legend(loc=1, fontsize=25) leg.get_frame().set_alpha(1) plt.show() return(w, p, i_eeg) return(w, i_eeg) #def p_cal(p): # p_sum = p[0]+p[1]+p[2] # p[0] = p[0]/p_sum#*p_sum # p[1] = p[1]/p_sum#*p_sum # p[2] = p[2]/p_sum#*p_sum # return p def cal(t, x): j = 0 x = list(x) xd.append(float((x[j+1] - x[j])/dt)) #xd[0] j+=1 for j in range(N-1): xd.append(float((x[j+1] - x[j])/dt))#xd[1] xdd.append(float((xd[j] - xd[j-1])/dt))#xdd[0] t.pop() x.pop() xd.pop() return (t,x) def func3(param, t, x, xd, xdd): residual = xdd + (param[0]*xd + param[1]*x + param[2]*x*x*x - param[3]*np.cos(w[0]*t)- param[4]*np.sin(w[0]*t)) return residual def lsm(t, x, xd, xdd): para = [0., 0., 0., 0., 0.] #para = [0, 0, 0, 0] t = np.array(t) x = np.array(x) xd = np.array(xd) xdd = np.array(xdd) params = leastsq(func3, para, args=(t, x, xd, xdd)) return params with open(outputData, mode='w') as OutputFile: with open(inputData, 'r') as InputFile: reader = csv.reader(InputFile, delimiter='\t') i = 0 z = 0 for row in reader: t.append(float(row[0])) eeg.append(float(row[4])) # print("{:d}".format(i)) # print("{:f}\t{:f}".format(float(row[0]), float(row[1]))) if(((i+1)%N==0) & (i>1)): print("fft_start") w, p, i_eeg = fft_peak(t, eeg) ieeg.extend(i_eeg) print(w) print(p) #p = p_cal(p) t, i_eeg = cal(t, i_eeg) Result = lsm(t, i_eeg, xd, xdd) print(Result) OutputFile.write("{:.3f}\t{:.6f}\t{:.6f}\t{:.6f}\t{:.6f}\t{:.6f}\t{:.6f}\n".format(0.510+z*dt*N,Result[0][0],Result[0][1],Result[0][2],Result[0][3],Result[0][4],w[0])) print("xdd + {:.6f}xd + {:.6f}x + {:.6f}x*x*x - {:.6f}cos{:.6f}t - {:.6f}sin{:.6f}t\n".format(Result[0][0],Result[0][1],Result[0][2],Result[0][3],w[0],Result[0][4],w[0])) z+=1 eeg = list() i_eeg = list() t = list() xd = list() xdd = list() # if(i > 1538): # break i+=1 ieeg = map(str,ieeg) textdata = '\n'.join(ieeg) with open(ifftData, 'wt') as f: f.write(textdata) # next(reader) |


