- 機械学習を習得するために必要なデータセットについて学ぶ.
- Scikit-learnのライブラリについて学ぶ.
- make_blobs,make_moons,make_circlesについて学ぶ.
こんにちは.けんゆー(@kenyu0501_)です.
機械学習のアルゴリズムを学習する際のデータセットとして非常に有名な3つのものを紹介します.
- make_blobs
- make_moons
- make_circles
pythonのscimitar-learnのライブラリですが,機械学習の分類やクラスタリングなどを,とりあえず手を動かしてやってみたい!という方に非常にオススメなものです.
この記事では,簡単なプログラムと,データ構造の図示化を行っていきます.
make_blobs
プログラムはこちら
1 2 3 4 5 6 7 8 9 10 11 12 13 14 15 16 17 18 19 20 21 22 23 24 25 26 | from sklearn.datasets import make_blobs import matplotlib.pyplot as plt X, y = make_blobs(n_samples=100, n_features=2, centers=3, cluster_std=1, center_box=(-10.0,10.0), shuffle=True, random_state=3,) print(X) print(y) a0, b0 = X[y==0,0], X[y==0,1] a1, b1 = X[y==1,0], X[y==1,1] a2, b2 = X[y==2,0], X[y==2,1] plt.figure(figsize=(8, 7)) plt.scatter(a0, b0, marker='o', s=25, label="y = 0") plt.scatter(a1, b1, marker='o', s=25, label="y = 1") plt.scatter(a2, b2, marker='o', s=25, label="y = 2") plt.legend() plt.xlabel("a") plt.ylabel("b") plt.show() |
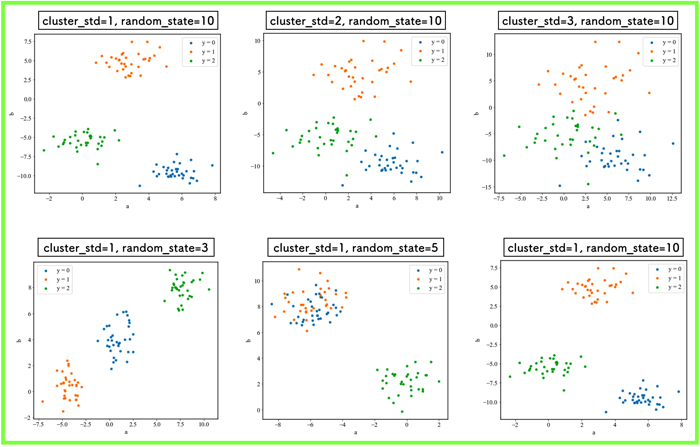
実際に,上記のプログラムを回すと,以下のような画像が出力されます.
サンプルの数や,乱数の度合いによっても変わるので,色々を試してみてください.
cluster_stdとrandom_stateの値を色々と変更して,結果の出力しました.



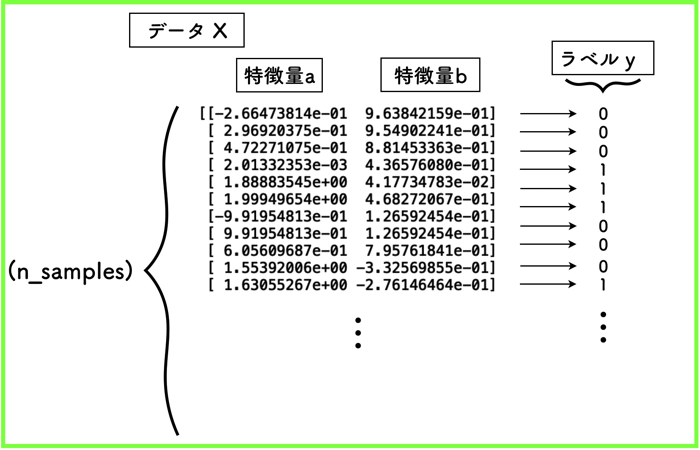
ちなみに,データ構造はこのようになっているよ!
make_moons
1 2 3 4 5 6 7 8 9 10 11 12 13 14 15 16 17 18 19 20 21 | from sklearn.datasets import make_moons import matplotlib.pyplot as plt X, y = make_moons(n_samples=200, shuffle = True, noise = None, random_state = True,) print(X) print(y) a0, b0 = X[y==0,0], X[y==0,1] a1, b1 = X[y==1,0], X[y==1,1] plt.figure(figsize=(8, 7)) plt.scatter(a0, b0, marker='o', s=25, label="y = 0") plt.scatter(a1, b1, marker='o', s=25, label="y = 1") plt.legend() plt.xlabel("a") plt.ylabel("b") plt.show() |
noiseの値を色々と変えて,結果を出力してみました.
noise = 0.3くらいになると,三日月型の分布が徐々に崩れ出してきてますね.

make_moons
1 2 3 4 5 6 7 8 9 10 11 12 13 14 15 16 17 18 19 20 21 22 | from sklearn.datasets import make_circles import matplotlib.pyplot as plt X, y = make_circles(n_samples=200, shuffle = True, noise = 0.2, random_state=None, factor = 0.7) print(X) print(y) a0, b0 = X[y==0,0], X[y==0,1] a1, b1 = X[y==1,0], X[y==1,1] plt.figure(figsize=(8, 7)) plt.scatter(a0, b0, marker='o', s=25, label="y = 0") plt.scatter(a1, b1, marker='o', s=25, label="y = 1") plt.legend() plt.xlabel("a") plt.ylabel("b") plt.show() |
noiseの値を色々と調整して分布を出しました.
noise=0.2くらいになると,円の分布が崩れてきますね.


機械学習を学ぶ際にも,助かるデータセットだと思うので,是非活用してみてね
