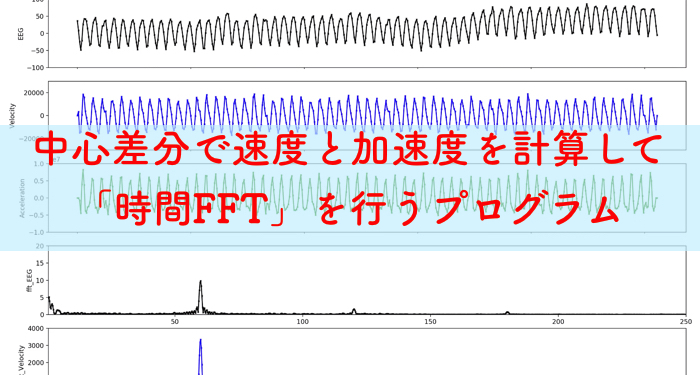
脳波解析などの時系列波形ではよく,時間周波数解析がされるのですが,今回は脳波の電位の周波数解析だけではなく,その速度と加速度を算出し時間FFTを同時に行うプログラムの公開をしておきます.
脳波でなくても,時系列信号の周波数特性を知りたい時には有効です.
(研究で用いるプログラムのアーカイブです)

基本的に,金曜日は研究のアーカイブ記事を書くぞ!!
どのようなインプット-アウトプットか
以下のアニメーションは,プログラムを回した時に作成されるインプットーアウトプットです.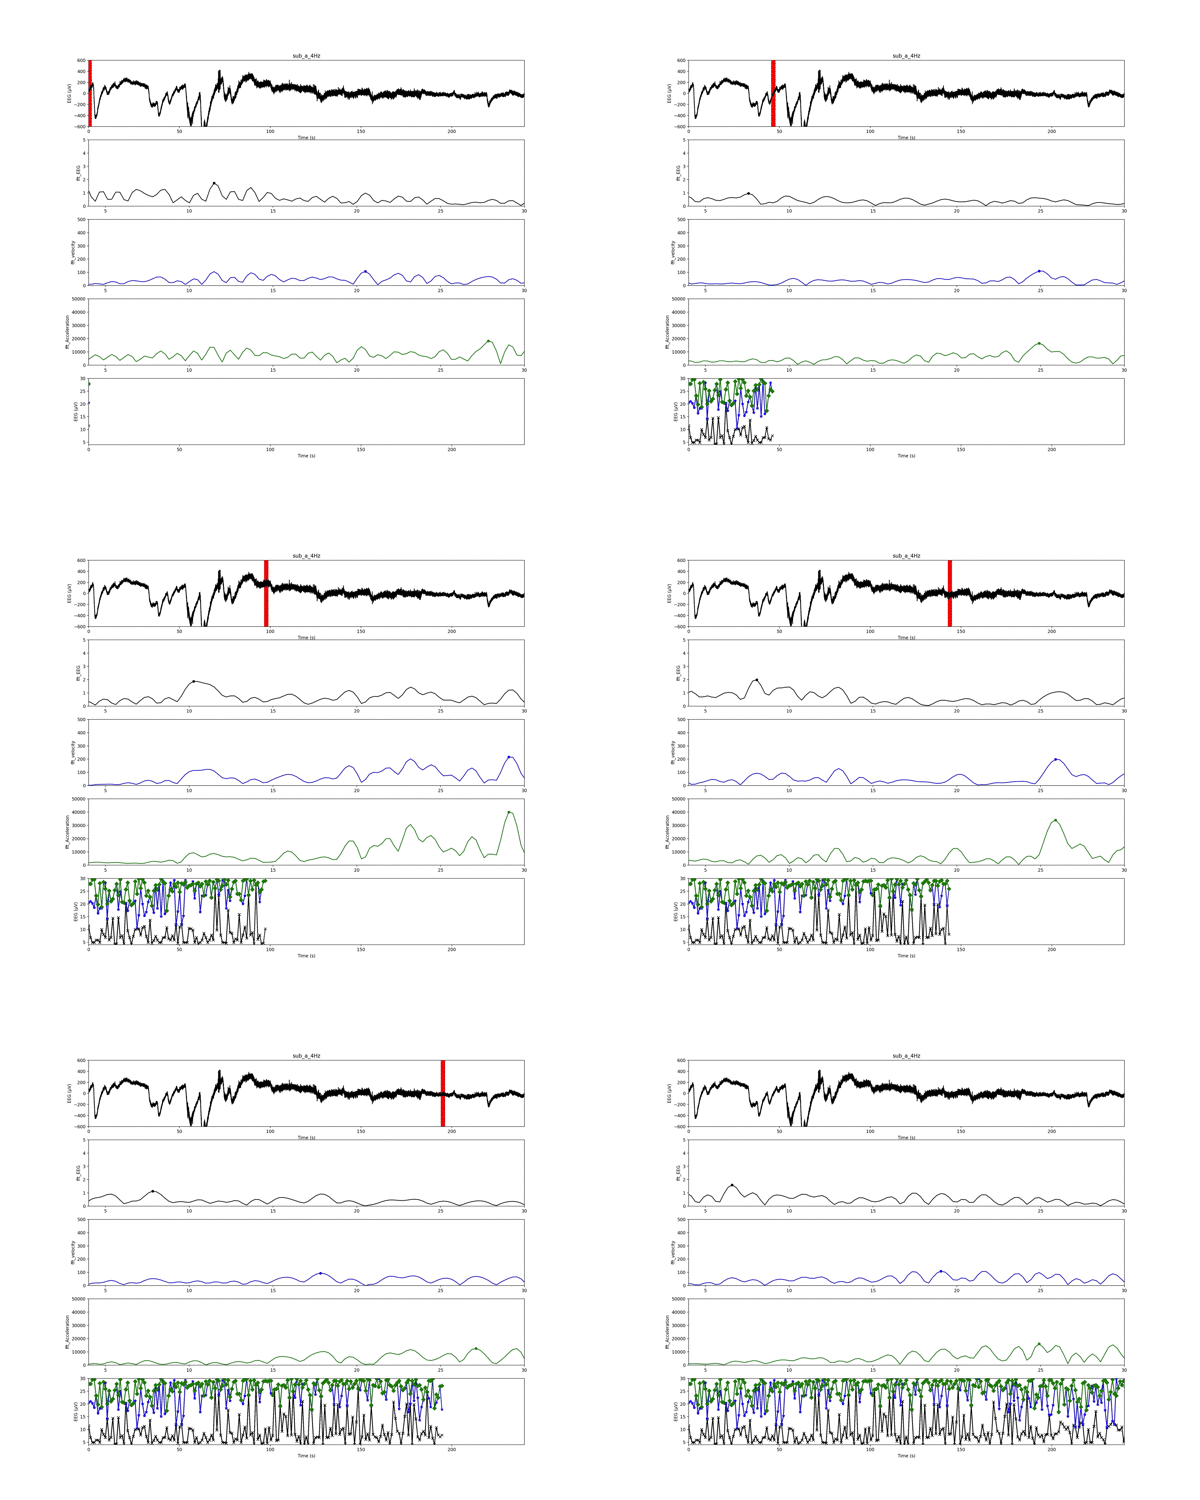
1番上の「実験値の生波形(脳波の電位)」の赤いスライドしている線が解析ウインドウです.
2〜4番目のグラフは解析ウインドウごとの周波数結果です!
現在は1秒ごとのデータで,4から30Hzのフィルタリングを施しています.
2番目のグラフが「電位の周波数」
3番目が「速度の周波数」
4番目が「加速度の周波数」
の結果です.
一番最後のグラフは,「電位」,「速度」,「加速度」の周波数結果のピークを解析窓ごとにプロットしたものになります.
加速度の周波数結果は,電位に比べて非常に大きくなるのですね!
しかし,周波数結果の概形はほとんど変わらないようです.
この記事はこんな人にオススメです. 「時間」周波数解析について知りたい人 時系列データの解析を行っている人 生…
Pythonプログラムについて
プログラムはPythonで記述しております.
以前質問があったので,ちょっと付け加えると,rowNっていうのは,解析するデータの列の指定になります.
ちなみに,速度と加速度は,電位の中心差分で算出してます.
また今度中心差分について詳しく記述します.
1 2 3 4 5 6 7 8 9 10 11 12 13 14 15 16 17 18 19 20 21 22 23 24 25 26 27 28 29 30 31 32 33 34 35 36 37 38 39 40 41 42 43 44 45 46 47 48 49 50 51 52 53 54 55 56 57 58 59 60 61 62 63 64 65 66 67 68 69 70 71 72 73 74 75 76 77 78 79 80 81 82 83 84 85 86 87 88 89 90 91 92 93 94 95 96 97 98 99 100 101 102 103 104 105 106 107 108 109 110 111 112 113 114 115 116 117 118 119 120 121 122 123 124 125 126 127 128 129 130 131 132 133 134 135 136 137 138 139 140 141 142 143 144 145 146 147 148 149 150 151 152 153 154 155 156 157 158 159 160 161 162 163 164 165 166 167 168 169 170 171 172 173 174 175 176 177 178 179 180 181 182 183 184 185 186 187 188 189 190 191 192 193 194 195 196 197 198 199 200 201 202 203 204 205 206 207 208 209 210 211 212 213 214 215 216 217 218 219 220 221 222 223 224 225 226 227 228 229 230 231 232 233 234 235 236 237 238 239 240 241 | # -*- coding: utf-8 -*- import csv import scipy.signal as sps from scipy.optimize import leastsq import numpy as np import matplotlib.pyplot as plt import matplotlib.animation as animation import matplotlib.patches as patches from time import sleep #frame = 241 frame = 241 #定数宣言 N = 512 # サンプル数 dt = 0.002 # サンプリング間隔 p_max = 30.0 p_min = 4 t_min = 0 t_max = 240 window = N*dt n_b = 512 n_a = 1024 inputData = 'exp.txt' outputMovie = 'result_a_4Hz.mp4' #exp.txtの解析する列指定 rowN = 1 figTitle = 'sub_a_4Hz' t = list() x_exp = list() def input_Data(): with open(inputData, 'r') as InputFile: reader = csv.reader(InputFile, delimiter='\t') for row in reader: t.append(float(row[0])) x_exp.append(float(row[rowN])) #中央差分 def CentralD(g): i = 1 gdot = list() for i in range(len(g)-2): gdot.append(float((g[i+1]-g[i-1])/(2*dt))) return gdot #2の累乗判定 def judge_pow2(x, x_m): nnn = len(x) if((nnn&(nnn-1))!=0): e_a = np.ceil(np.log2(nnn)) n_add = int((2**e_a)-nnn) x = np.hstack((x, np.full(n_add, x_m))) return x #x_exp_s...fftに送って、長さを2のべき乗に合わせてから、fftをしてバンドパスをしてifftしてifftをリターンする #xdd_exp...fftに送って、第1ピークを探してwを取得してリターンする #fft_peak検出用関数 def fft_peak(x, x_m): #分解能向上用パディング x = np.hstack((np.full(n_b, x_m), x, np.full(n_a, x_m))) len_x = len(x) peak_idx = list() # データのパラメータ freq = np.linspace(0, 1.0/dt, len_x) # 周波数軸 print(freq) # 高速フーリエ変換 F = np.fft.fft(x) Power = F.copy() # 振幅スペクトルを計算 Power = np.abs(Power) # 振幅を元の信号のスケールに揃える Power = Power / ((len_x)/2) # 交流成分はデータ数で割って2倍する Power[0] = Power[0] / 2 # 直流成分 # FFTデータからピークを自動検出 peak_idx = sps.argrelmax(Power, order=3)[0] # 極大値の取得(orderでピークの最小間隔指定) # 閾値より小さい振幅ピークの除外 + 0.5~30Hzの帯域制限 peak_cut = 0.2 # ピーク閾値 peak_idx = peak_idx[(Power[peak_idx] > peak_cut) & (freq[peak_idx] >= p_min) & (freq[peak_idx] <= p_max)] selected_peakPower = zip(Power[peak_idx], freq[peak_idx]) #パワー値の大きい順に並べ替え peak = sorted(selected_peakPower, reverse=True) p, f = zip(*peak) p = list(p) f =list(f) del f[1:] print(f) del p[1:] # print(p) return f, p, Power, freq def main(TimeStep): global x_exp, t x_exp_s = x_exp[TimeStep*N:(TimeStep+1)*N] t_s = t[TimeStep*N:(TimeStep+1)*N] xd_exp = CentralD(x_exp_s) xdd_exp = CentralD(xd_exp) x_m = np.mean(x_exp_s) #fft用にデータ数を2のべき乗に揃える # x_exp_s = judge_pow2(x_exp_s, x_m) f_x, p_x, Power_x, freq_x = fft_peak(x_exp_s, x_m) xd_m = np.mean(xd_exp) xd_exp = np.hstack((np.full(1, xd_m), xd_exp, np.full(1, xd_m))) # xd_exp = judge_pow2(xd_exp, xd_m) f_xd, p_xd, Power_xd, freq_xd = fft_peak(xd_exp, xd_m) xdd_m = np.mean(xdd_exp) xdd_exp = np.hstack((np.full(2, xdd_m), xdd_exp, np.full(2, xdd_m))) # xdd_exp = judge_pow2(xdd_exp, xdd_m) f_xdd, p_xdd, Power_xdd, freq_xdd = fft_peak(xdd_exp, xdd_m) return t_s, x_exp_s, Power_x, freq_x, f_x, p_x, xd_exp, Power_xd, freq_xd, f_xd, p_xd, xdd_exp, Power_xdd, freq_xdd, f_xdd, p_xdd #グラフ用意 fig = plt.figure(figsize=(18,16)) ax1 = plt.subplot2grid((5,1), (0,0)) #ax2 = plt.subplot2grid((8,1), (1,0)) #ax3 = plt.subplot2grid((8,1), (2,0), sharex = ax2) #ax4 = plt.subplot2grid((8,1), (3,0), sharex = ax2) #ax5 = plt.subplot2grid((8,1), (4,0)) #ax6 = plt.subplot2grid((8,1), (5,0), sharex = ax5) #ax7 = plt.subplot2grid((8,1), (6,0), sharex = ax5) #ax8 = plt.subplot2grid((8,1), (7,0), sharex = ax1) ax5 = plt.subplot2grid((5,1), (1,0)) ax6 = plt.subplot2grid((5,1), (2,0), sharex = ax5) ax7 = plt.subplot2grid((5,1), (3,0), sharex = ax5) ax8 = plt.subplot2grid((5,1), (4,0), sharex = ax1) def update_fig1(): global x_exp, t ax1.cla() ax1.set_title(figTitle) ax1.set_xlim(t_min, t_max) ax1.set_ylabel('EEG (μV)') ax1.set_ylim([-600,600]) ax1.set_xlabel('Time (s)') ax1.plot(t, x_exp, 'k') #時間配列, 実験値配列, 色 input_Data() def update_fig(): # ax2.cla() # ax3.cla() # ax4.cla() ax5.cla() ax6.cla() ax7.cla() # ax2.set_ylabel('EEG') # ax2.set_ylim(-100, 100) # ax2.tick_params(length=2, axis='x',labelbottom='off') # ax3.set_ylabel('Velocity') # ax3.set_ylim(-2.5e4, 2.5e4) # ax3.tick_params(length=2, axis='x',labelbottom='off') # ax4.set_ylabel('Acceleration') # ax4.set_ylim(-1e7, 1e7) # ax4.tick_params(length=2, axis='x',labelbottom='off') ax5.set_ylabel('fft_EEG') ax5.set_ylim(0, 5) ax5.set_xlim(4, 30) ax6.set_ylabel('fft_velocity') ax6.set_ylim(0, 500) ax7.set_ylabel('fft_Acceleration') ax7.set_ylim(0, 50000) def update_fig8(): ax8.cla() ax8.set_xlim(t_min, t_max) ax8.set_ylabel('EEG (μV)') ax8.set_ylim([4,30]) ax8.set_xlabel('Time (s)') tm = list() fr_x = list() fr_xd = list() fr_xdd = list() def update(timestep): global tm, fr_x, fr_xd, fr_xdd t_s, x_exp_s, Power_x, freq_x, f_x, p_x, xd_exp, Power_xd, freq_xd, f_xd, p_xd, xdd_exp, Power_xdd, freq_xdd, f_xdd, p_xdd = main(timestep) #描画 if timestep % frame == 0: update_fig8() tm = list() fr_x = list() fr_xd = list() fr_xdd = list() tm.append(float(timestep*window)) fr_x.append(float(f_x[0])) fr_xd.append(float(f_xd[0])) fr_xdd.append(float(f_xdd[0])) else: tm.append(float(timestep*window)) fr_x.append(float(f_x[0])) fr_xd.append(float(f_xd[0])) fr_xdd.append(float(f_xdd[0])) #グラフ1の初期化 update_fig1() update_fig() #ウィンドウの表示 r = patches.Rectangle(xy=((timestep-1/2)*window, -600.0), width=window*2, height=1200.0, ec='r', fc='r') ax1.add_patch(r) # ax2.plot(t_s, x_exp_s, 'k', marker="x", markersize=2) # ax3.plot(t_s, xd_exp, 'b', marker="x", markersize=2) # ax4.plot(t_s, xdd_exp, 'g', marker="x", markersize=2) ax5.plot(freq_x, Power_x, 'k') ax5.plot(f_x[0], p_x[0], 'k', marker="o", markersize=5) ax6.plot(freq_xd, Power_xd, 'b') ax6.plot(f_xd[0], p_xd[0], 'b', marker="o", markersize=5) ax7.plot(freq_xdd, Power_xdd, 'g') ax7.plot(f_xdd[0], p_xdd[0], 'g', marker="o", markersize=5) ax8.plot(tm, fr_x, 'k', marker="x") # ax8.plot(timestep*window, f_x[0], 'k', marker="x", markersize=2) ax8.plot(tm, fr_xd, 'b', marker="*") # ax8.plot(timestep*window, f_xd[0], 'b', marker="^", markersize=2) ax8.plot(tm, fr_xdd, 'g', marker="D") # ax8.plot(timestep*window, f_xdd[0], 'g', marker="D", markersize=2) ani = animation.FuncAnimation(fig, update, interval=50, frames=frame) #plt.show() ani.save(outputMovie) #保存 |
コメントアウトを適宜外して,調節すると,速度と加速度も表示することができますよ!
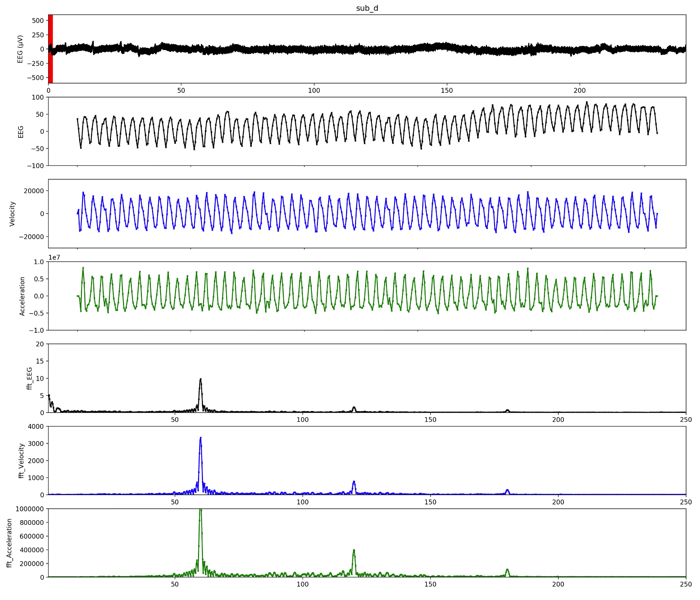
こんな感じです〜!
では,良い解析ライフをー!
プログラムの補足
2の累乗を判定する関数
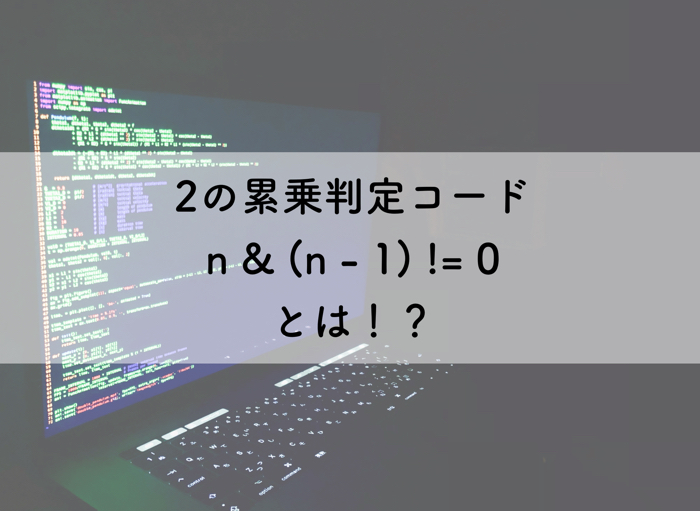
上のコード中のこちらの関数について,
1 2 3 4 5 6 7 8 | #2の累乗判定 def judge_pow2(x, x_m): nnn = len(x) if((nnn&(nnn-1))!=0): e_a = np.ceil(np.log2(nnn)) n_add = int((2**e_a)-nnn) x = np.hstack((x, np.full(n_add, x_m))) return x |
具体的な説明を以下で解説しましたので,是非ご覧ください.
この記事はこんな人にオススメです 2の累乗を判別するコードを書きたい人 その意味をしっかりと理解したい人 プロ…

