- 非線形サポートベクターマシンを研究している人
- 分類問題を解くために機械学習を勉強している人
- 研究にモデルパラメータ同定を行なっている人
こんにちは.けんゆー(@kenyu0501_)です.
研究アーカイブとして残しておきますが,見たい方は見てください.
何をしているのかというと,
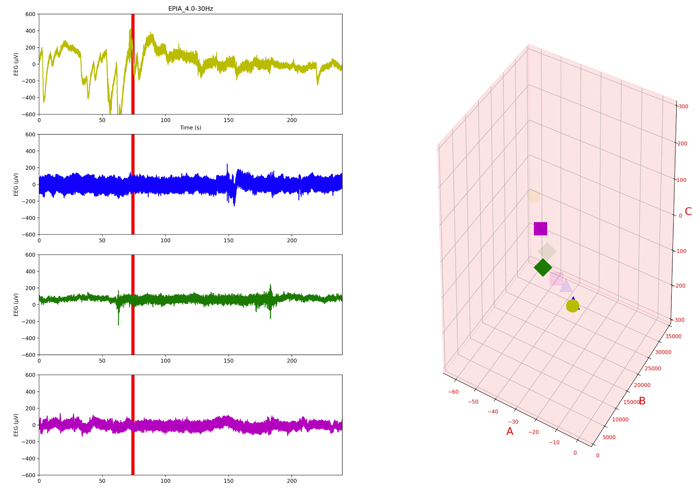
- 脳波信号のモデリングを行ない,
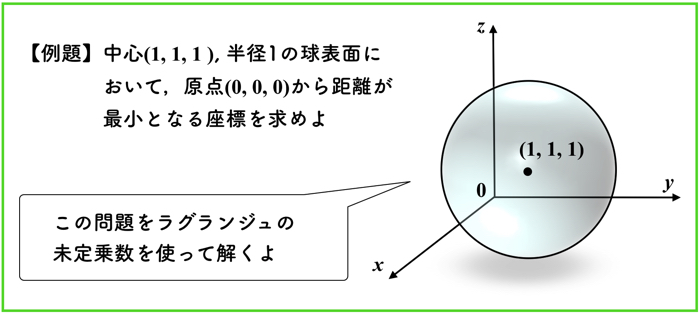
- 逆問題を解くことでモデルパラメータを同定し,
- 集中状態,安静状態を決めるためにSVMで分類
的なことをやっています.
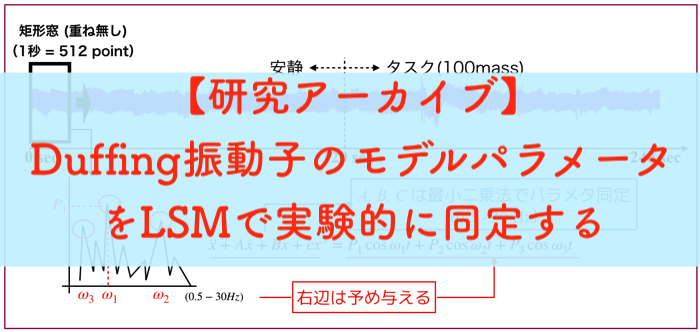
詳しくは,研究アーカイブに残しているので,勝手に見てくださいませ.
こんにちは.けんゆーです(@kenyu0501_). 研究アーカイブです. 最近は,毎日研究に加え,スタディサ…
現在,結果を色々と論文にまとめていたりするので,主要な解析データは見せることができないのです.
が,,,,使っているプログラムなどはおいらのブログで管理していこうと思っていますので,使いたい人はどうぞ!
一部の使わないデータを先に見せておくとこのような感じで分類ができます.
集中時(赤)でリラックス時(青)です.
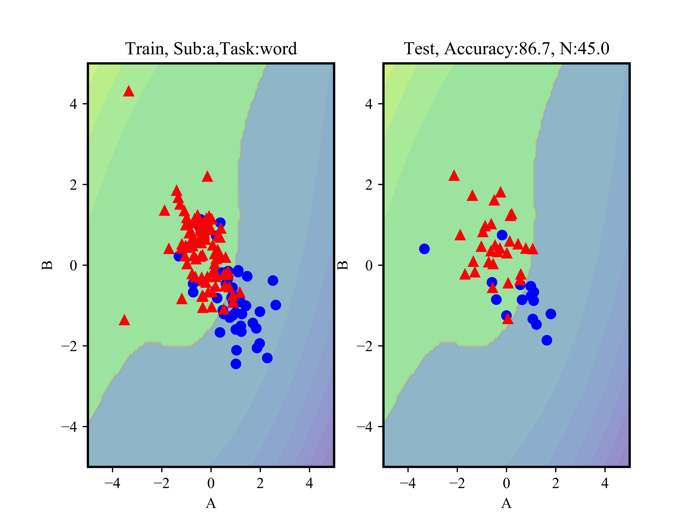
線形分離ができないデータなので,あまりよろしくないデータですが,このように非線形分類が可能です.
左側が,分類をする線を引くために使用したデータで,右側が,その線が上手く機能しているかをテストしているデータです.
上に正解率が出ていますが,だいたい87%は分類できているっぽいですね!
データ自体があまり良くないので,実験データも色々と取り直さないといけないっす...
非線形サポートベクターマシンのプログラムについて
特に自分のアーカイブなので詳細な説明はしないと思いますがざっくりと書いていきます.
1 2 3 4 5 6 7 8 9 10 11 12 13 14 15 16 17 18 19 20 21 22 23 24 25 26 27 28 29 30 31 32 33 34 35 36 37 38 39 40 41 42 43 44 45 46 47 48 49 50 51 52 53 54 55 56 57 58 59 60 61 62 63 64 65 66 67 68 69 70 71 72 73 74 75 76 77 78 79 80 81 82 83 84 85 86 87 88 89 90 91 92 | # -*- coding: utf-8 -*- import numpy as np import matplotlib.pyplot as plt from sklearn.model_selection import train_test_split from sklearn.preprocessing import StandardScaler from sklearn.pipeline import Pipeline from sklearn.preprocessing import PolynomialFeatures from sklearn.svm import SVC #----------plt.全体で設定される---------------# plt.rcParams['font.family'] = 'Times New Roman' #全体のフォントを設定 plt.rcParams['font.size'] = 10 #フォントサイズを設定 plt.rcParams['axes.linewidth'] = 1.5 #軸の太さを設定。目盛りは変わらない #------------------------------------------# #----------解析データ用の名前-----------------# subject = "b" task = "100" #100,game,word #-----------------------------------------# #----------解析データの読み込み---------------# inputTarget = 'rectan_3s/target.txt' inputData_a = 'rectan_3s/para4Freq3_%s_%s_3s.txt' %(subject,task) target = np.loadtxt(inputTarget, dtype='float') dataA = np.loadtxt(inputData_a, delimiter='\t', dtype='float') #-----------------------------------------# X = np.vstack((dataA[:180, 1:3])) #rabelを追加 0=relax,1=stress y = np.hstack((target[:180])) y = y.astype(np.int64) #解析データの分布を標準化しておく scaler = StandardScaler() X = scaler.fit_transform(X) X_train, X_test, y_train, y_test = train_test_split(X, y, stratify=y, random_state=0) print(X_test.shape[0]) X_train_number = X_test.shape[0] #----------グラフ描写用の関数---------------# def plot_decision_function(model): _x0 = np.linspace(-5.0, 5.0, 100) _x1 = np.linspace(-5.0, 5.0, 100) x0, x1 = np.meshgrid(_x0, _x1) X = np.c_[x0.ravel(), x1.ravel()] y_pred = model.predict(X).reshape(x0.shape) y_decision = model.decision_function(X).reshape(x0.shape) plt.contourf(x0, x1, y_pred, cmap=plt.cm.brg, alpha=0.2) plt.contourf(x0, x1, y_decision,levels=10,alpha=0.3) def plot_dataset(X,y): plt.plot(X[:, 0][y==0], X[:, 1][y==0], "bo", ms=10) plt.plot(X[:, 0][y==1], X[:, 1][y==1], "r^", ms=10) plt.xlabel("A") plt.ylabel("B") #---------------------------------------# #--SVM-カーネル法(pipelineを使う) ---------# kernel_svm = Pipeline([ ('scaler',StandardScaler()), ('svm', SVC(kernel='poly', degree=3, coef0=1)) ]) print(kernel_svm.fit(X_train,y_train)) print(X.shape) kernel_svm.fit(X_train,y_train) #テストデータを使って,予測した分類がそれぞれ正しいのかを見る print(kernel_svm.predict(X_test) == y_test) R = kernel_svm.predict(X_test) total = len(X_test) success = sum(R == y_test) print('被験者%sのタスク%sの正解率=' %(subject,task)) print(100.0*success/total) #--------------------------------------# #--グラフを描写するor保存する(1行2列で)------# plt.subplot(121) plot_decision_function(kernel_svm) plot_dataset(X_train,y_train) plt.title('Train, Sub:%s,Task:%s'%(subject,task)) plt.subplot(122) #plt.figure(figsize=(12,8)) plot_decision_function(kernel_svm) plot_dataset(X_test,y_test) #plt.show() plt.title('Test, Accuracy:{:.1f}, N:{:.1f}'.format(100.0*success/total, X_train_number) ) plt.savefig('para4Freq3_%s_%s_3s.png' %(subject, task), dpi=1200) #plt.show() #--------------------------------------# |
ちょっと丁寧にコメントをつけましたので,追えるかもしれません.
SVMのパラメータ
今回カーネル法ではパイプラインによる記述をしましたが,X_train,y_trainのデータは以下のようなパラメータでSVMが使用されています..
1 2 3 4 5 | Pipeline(memory=None, steps=[('scaler', StandardScaler(copy=True, with_mean=True, with_std=True)), ('svm', SVC(C=1.0, cache_size=200, class_weight=None, coef0=1, decision_function_shape='ovr', degree=3, gamma='auto_deprecated', kernel='poly', max_iter=-1, probability=False, random_state=None, shrinking=True, tol=0.001, verbose=False))]) |

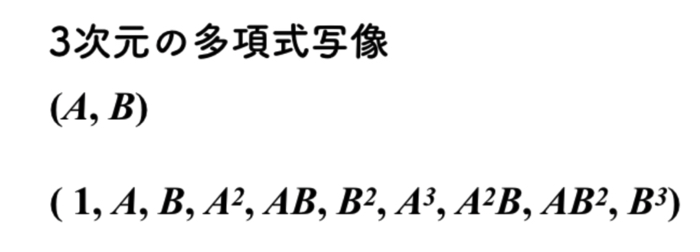
多項式カーネル”Poly”
特徴量の高次元写像には,多項式カーネルを用いて,3次元の写像を行なっています.
標準化”Standard Scalar”
データの前処理には,標準化を行なっています.

使用するデータの分布が色々と幅広いので,他条件データを比較するために標準化をします.
重要なことはそのくらいですかね.
参考になればしてみてください.
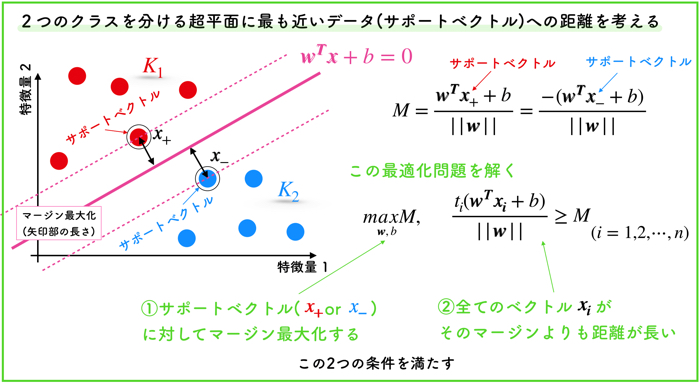
理論の話などはいかにまとめています.
この記事はこんな人にオススメです SVMを使えるだけではなく,きちんと理解したい人 SVMを解く最適化問題に使…
