- 非線形振動子に興味がある人
- Duffingとvan der Pol振動子の時系列波形のアニメーションが見たい人
- 何かしらの現象の数学モデルを作っている人
こんにちは.けんゆーです(@kenyu0501_)
今日は以下2つの非線形振動子についての記事を書きます.
- 3次の非線形項を持つダフィング振動子
- 非線形減衰項を持つファンデルポール振動子
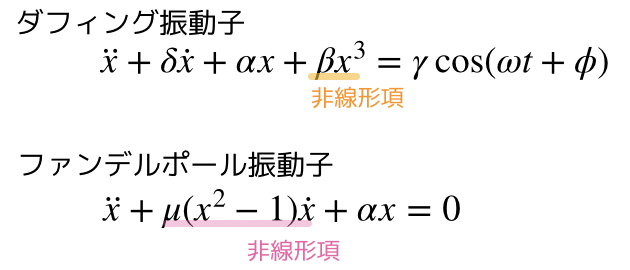
それぞれ,動く時系列波形をPythonで実装したので,時系列波形の挙動の確認も兼ねて公開しようと思います.
時系列波形について
ダフィング振動子


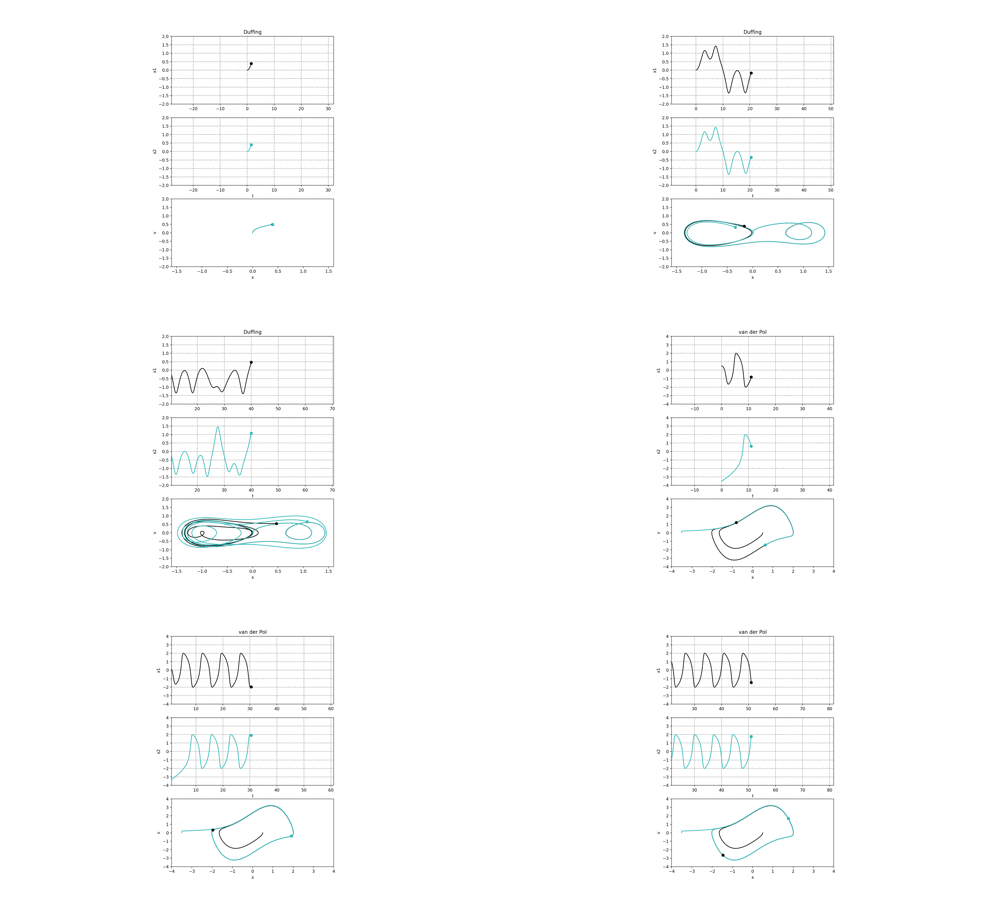
ダフィング振動子はカオスを示す系としてよく知られています.
カオスとは初期値依存性がかなり大きく,初期値のちょっとした誤差で t → ∞ 時の挙動が全く異なったものになります.
下の図の初期位置および初期速度はそれぞれ
- 黒の波形→(x0,v0) = (0.0, 0.0)
- 緑の波形→(x0,v0) = (0.001, 0.0)
x-v平面を確認すると,初めの軌道はあってますが,時間が経つにつれて徐々に離れていき,それはやがて完全に異なった軌道になります.
これはランダムでは無く決定論的な振る舞いになるので,初期値が一緒であれば,全ての時間において同じ運動をします.
しかしスタートがちょっとだけでもずれると,長時間に渡って相関を維持することができなくなります.
またDuffing振動子の中身を詳しく知りたい人はこちらをチェック!
(参考:「2重井戸を左右に揺らしてみるよ(Duffing型の非線形振動子で確認)」)
またプログラミングは一番下にあります.
ファンデルポール振動子

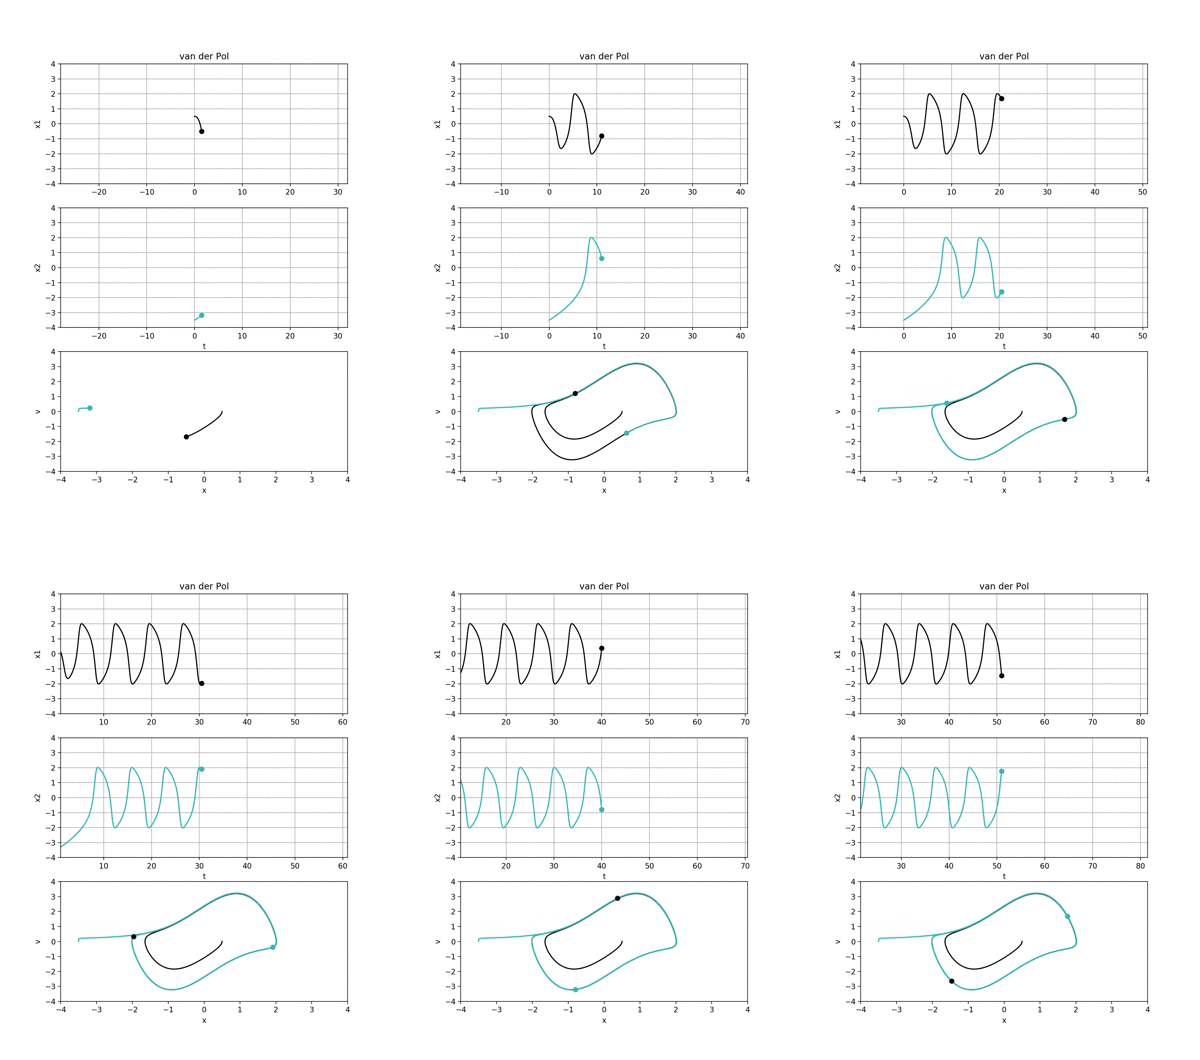
ファンデルポール振動子はリミットサイクルを形成することで有名です.
リミットサイクルについて詳しく知りたい人は,以下をご覧ください.
(参考:「リミットサイクルは自励振動をする凄いやつ」)
自励的な振動を起こすので,右辺の項は別に0でも構いません.
初期位置と初期速度が異なる二つの波形は面白いことにどちらもリミットサイクルに漸近します.
ダフィングは初期値がちょっとでもずれたら,軌道は大きく外れるのにファンデルポールは同じ波形になるのですね.
しかも,周期外力が無いのにも関わらず振動している,,,
凄い...
ちなみに,初期位置と初期速度はそれぞれ
- 黒の波形→(x0,v0) = (0.5, 0.0)
- 緑の波形→(x0,v0) = (-3.5, 0.0)
です.
Pythonプログラミングについて
Pythonプログラムに関して,アニメーション風にするのですがこちらのページを参考にしました.
(参考:「Hodgkin-Huxleyモデルをアニメーションで見る」)
時間軸の推移を追加で足しており,点がグラフ中心を動くように改良してます.
ちなみに関係ないですが,Hodgkin-Huxleyモデルについて詳しく知りたい方はこちら
(参考:「脳神経細胞の活動を数学的に書くHodgkin-Huxleyモデルについて」)
ダフィング振動子プログラミング
1 2 3 4 5 6 7 8 9 10 11 12 13 14 15 16 17 18 19 20 21 22 23 24 25 26 27 28 29 30 31 32 33 34 35 36 37 38 39 40 41 42 43 44 45 46 47 48 49 50 51 52 53 54 55 56 57 58 59 60 61 62 63 64 65 66 67 68 69 70 71 72 73 74 75 76 77 78 79 80 81 82 83 84 | import numpy as np import matplotlib.pyplot as plt import matplotlib.animation as animation from scipy.integrate import odeint from time import sleep from PIL import Image, ImageDraw images = [] A = 1/4 B = 1.0 C = 1.0 P1 = 0.4 omega = 1.0 phi = 0.0 dt = 0.002 timestep = 0.5 timecount = 1 def duffing(var, t, A, B, C, F0, omega, phi): global timecount dx = var[1] dv = -A*var[1] +B*var[0] - C*var[0]**3 + P1*np.cos(omega * t + phi) return np.array([dx, dv]) fig, (ax1, ax2, ax3) = plt.subplots(nrows=3,ncols=1, figsize=(7,10)) def update(i): global var10, timecount t = np.arange(0.0, timecount, dt) len_t = len(t) var10 = [0.0, 0.0] var20 = [0.001, 0.0] ax1.cla() ax2.cla() ax3.cla() if timecount == 100: timecount = 10.0 else: timecount += timestep var1 = odeint(duffing, var10, t, args=(A, B, C, P1, omega, phi)) var2 = odeint(duffing, var20, t, args=(A, B, C, P1, omega, phi)) x1 = var1[:,0] v1 = var1[:,1] x2 = var2[:,0] v2 = var2[:,1] ax1.set_title('Duffing') ax1.plot(t, x1, 'k') ax1.plot(t[len_t-1],x1[len_t-1],'ko') ax1.set_ylabel('x1') ax1.set_ylim([-2.0,2.0]) ax1.set_xlim([timecount-30, timecount+30]) ax1.grid() ax2.plot(t, x2, 'c') ax2.plot(t[len_t-1],x2[len_t-1],'co') ax2.set_ylabel('x2') ax2.set_xlim([timecount-30, timecount+30]) ax2.set_ylim(-2,2) ax2.grid() ax2.set_xlabel('t') ax3.plot(x1, v1, 'k') ax3.plot(x2, v2, 'c') ax3.plot(x1[len_t-1],v1[len_t-1],'ko') ax3.plot(x2[len_t-1],v2[len_t-1],'co') ax3.set_ylabel('v') ax3.set_ylim(-2, 2) ax3.set_xlim(-1.6, 1.6) ax3.set_xlabel('x') ani = animation.FuncAnimation(fig, update, interval=100, frames=100) plt.show() #ani.save("duffing.mp4") |
ファンデルポール振動子プログラミング
1 2 3 4 5 6 7 8 9 10 11 12 13 14 15 16 17 18 19 20 21 22 23 24 25 26 27 28 29 30 31 32 33 34 35 36 37 38 39 40 41 42 43 44 45 46 47 48 49 50 51 52 53 54 55 56 57 58 59 60 61 62 63 64 65 66 67 68 69 70 71 72 73 74 75 76 77 78 79 80 81 | import numpy as np import matplotlib.pyplot as plt import matplotlib.animation as animation from scipy.integrate import odeint from time import sleep from PIL import Image, ImageDraw images = [] B = 1.0 u = 1.5 dt = 0.002 timestep = 0.5 timecount = 1 def vanderPol(var, t, u, B): global timecount dx = var[1] dv = -u*(var[0]*var[0]-1)*var[1]-B*var[0] return np.array([dx, dv]) fig, (ax1, ax2, ax3) = plt.subplots(nrows=3,ncols=1, figsize=(7,10)) def update(i): global var10, timecount t = np.arange(0.0, timecount, dt) len_t = len(t) var10 = [0.5, 0.0] var20 = [-3.5, 0.0] ax1.cla() ax2.cla() ax3.cla() if timecount == 100: timecount = 10.0 else: timecount += timestep #微分方程式を解く var1 = odeint(vanderPol, var10, t, args=(u, B)) var2 = odeint(vanderPol, var20, t, args=(u, B)) x1 = var1[:,0] v1 = var1[:,1] x2 = var2[:,0] v2 = var2[:,1] ax1.set_title('van der Pol') ax1.plot(t, x1, 'k') ax1.plot(t[len_t-1],x1[len_t-1],'ko') ax1.set_ylabel('x1') ax1.set_ylim([-4.0,4.0]) ax1.set_xlim([timecount-30, timecount+30]) ax1.grid() ax2.plot(t, x2, 'c') ax2.plot(t[len_t-1],x2[len_t-1],'co') ax2.set_ylabel('x2') ax2.set_xlim([timecount-30, timecount+30]) ax2.set_ylim(-4,4) ax2.grid() ax2.set_xlabel('t') ax3.plot(x1, v1, 'k') ax3.plot(x2, v2, 'c') ax3.plot(x1[len_t-1],v1[len_t-1],'ko') ax3.plot(x2[len_t-1],v2[len_t-1],'co') ax3.set_ylabel('v') ax3.set_ylim(-4, 4) ax3.set_xlim(-4, 4) ax3.set_xlabel('x') ani = animation.FuncAnimation(fig, update, interval=100, frames=100) plt.show() #ani.save("vanderPol.mp4") |
では〜!

